A test run that prints nothing useful is a test run nobody trusts. Your pipeline goes red, someone opens the build log, and all they find is a wall of timestamps and a non-zero exit code. Which assertion broke? Against which environment? On which row of the data file? The run knew. It just never wrote it down anywhere you could read it later.
That is the gap a reporter fills. When you run API tests from the command line, the report is the part you actually live with: the artifact you archive, the file your CI dashboard parses, the thing you hand a teammate at 9 a.m. who wasn’t watching the pipeline at 2 a.m. The test verdict is only half the job. The other half is making that verdict legible to a human and to a machine at the same time.
The Apidog command-line runner handles both. Apidog ships a CLI that runs the test scenarios you built visually in the app, and one flag controls every report it produces: -r, --reporters. You pass it a comma-separated list, the runner writes each format to disk, and you decide who reads what. This guide is about that flag and the files it produces: what each reporter is for, what lands on disk, where it lands, and how to wire each one into a real workflow. If you want the broader tour of every flag the runner accepts, the apidog run command reference covers the full surface; this page stays on reports.
Why the report matters more than the run
Run a scenario locally and you watch it happen. You see each request fire, each assertion turn green, the summary at the end. The feedback loop is the terminal in front of you, live.
In CI, that loop is gone. The run happens on a machine you never see, at a time you weren’t watching, and the only record is whatever got written to disk before the runner exited. If the run produced no report, a failure tells you only that something broke. You’re left rerunning the whole thing locally and hoping it breaks the same way.
A good report closes that distance. It captures which scenario ran, against which environment, how many iterations, which assertions passed, which failed, and the request and response detail behind each failure. Get that on disk and a 2 a.m. failure becomes a five-minute read the next morning instead of a reproduction hunt. That’s the entire reason the reporter flag exists, and it’s why picking the right format for each audience is worth a few minutes of thought.
The one flag that controls every report
The Apidog CLI is an npm package called apidog-cli. Install it once and you get a single binary, apidog, whose main subcommand is run. Install it globally:
npm install -g apidog-cli
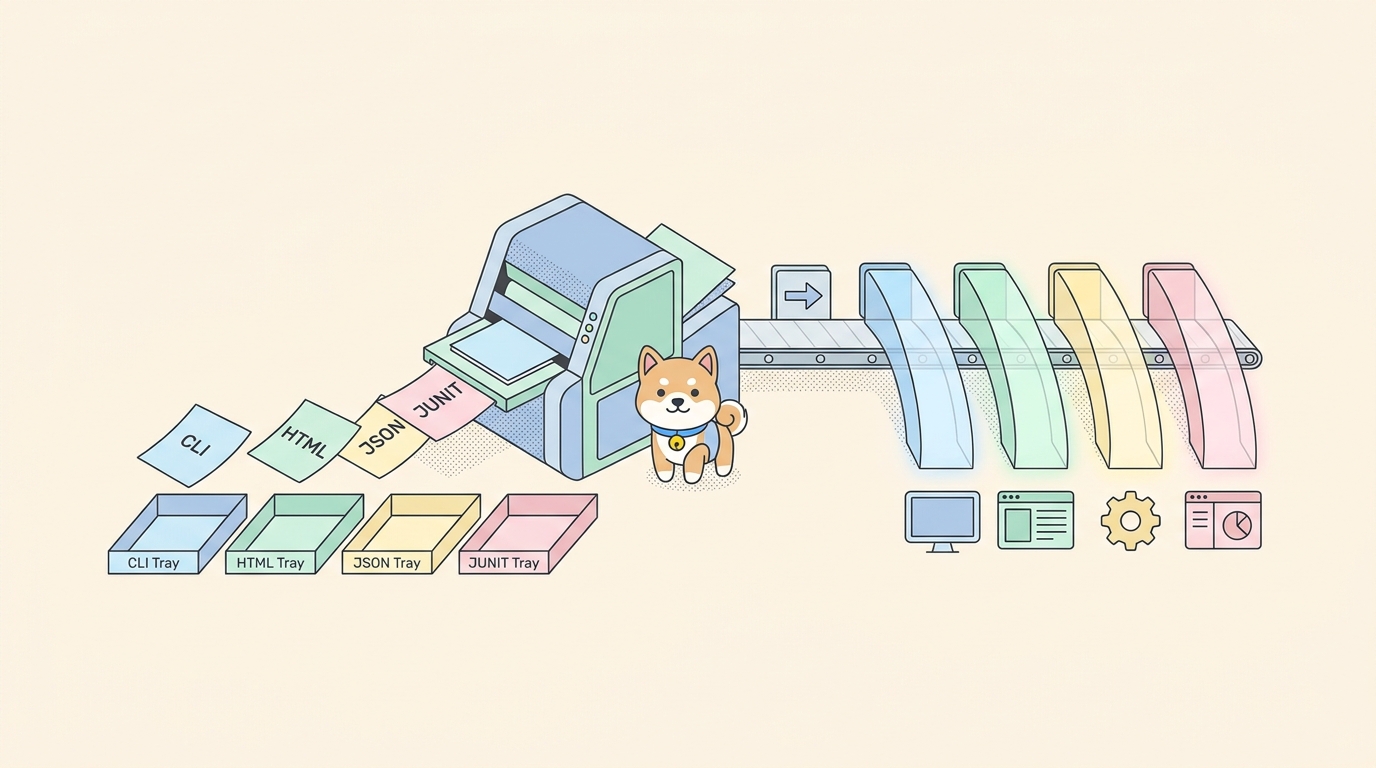
Every report the runner can produce comes from one flag on that command: -r, --reporters. It takes a comma-separated list, and the four values it accepts are cli, html, json, and junit. The default, if you pass nothing, is cli.
A complete run with two reporters looks like this:
apidog run --access-token $APIDOG_ACCESS_TOKEN -t 605067 -e 1629989 -n 1 -r html,cli
That authenticates with a token, runs test scenario 605067 against environment 1629989 once, and emits both an HTML file and readable terminal output. The IDs are the scenario ID and the environment ID; you copy both, along with the access token, from the scenario’s CI/CD tab in Apidog rather than typing them by hand. If any of that setup is unfamiliar, the Apidog CLI complete guide walks through install, tokens, and your first run end to end.
The key idea: one run can produce several reports at once. You aren’t choosing a single format. You’re choosing an audience for each output and listing them together. A typical CI line emits a human-readable HTML file and a machine-readable JUnit file from the same execution, so the same run serves both a person and a dashboard.
cli: the report you read in the build log
The cli reporter prints a readable summary straight to the terminal. It’s the default, and it’s the one a human scans first.
apidog run --access-token $APIDOG_ACCESS_TOKEN -t 605067 -e 1629989 -r cli
What it gives you is the live verdict: how many requests ran, how many assertions passed and failed, and which specific assertions broke. In a CI build log, this is the block someone reads when they click into a failed job. It tells them at a glance whether the failure is one broken assertion or fifty, and which endpoint is involved, before they bother downloading anything.
Keep cli on even when you’re writing machine formats. It costs nothing and it keeps the build log useful on its own. A pipeline that emits only JUnit XML produces a perfect dashboard and a useless log; anyone reading the raw output sees nothing but the runner starting and exiting. Adding cli to the list fixes that:
apidog run --access-token $APIDOG_ACCESS_TOKEN -t 605067 -e 1629989 -r cli,junit --out-dir ./apidog-reports
Two more flags shape what cli prints. --verbose expands it to the full request and response for every step, which is your first move when a scenario passes on your laptop but fails in the pipeline; the wire detail shows you exactly what the runner sent and got back. --silent does the opposite and suppresses console output entirely, which suits a noisy scheduled job where you only care about the exit code and the saved file.
html: the report you hand to a human
The html reporter writes a self-contained HTML file. Open it in any browser and you get the full run laid out visually: every request, the assertions on it, pass and fail status, and the request and response detail behind each step. Nothing to install, no server to run; it’s one file you double-click.
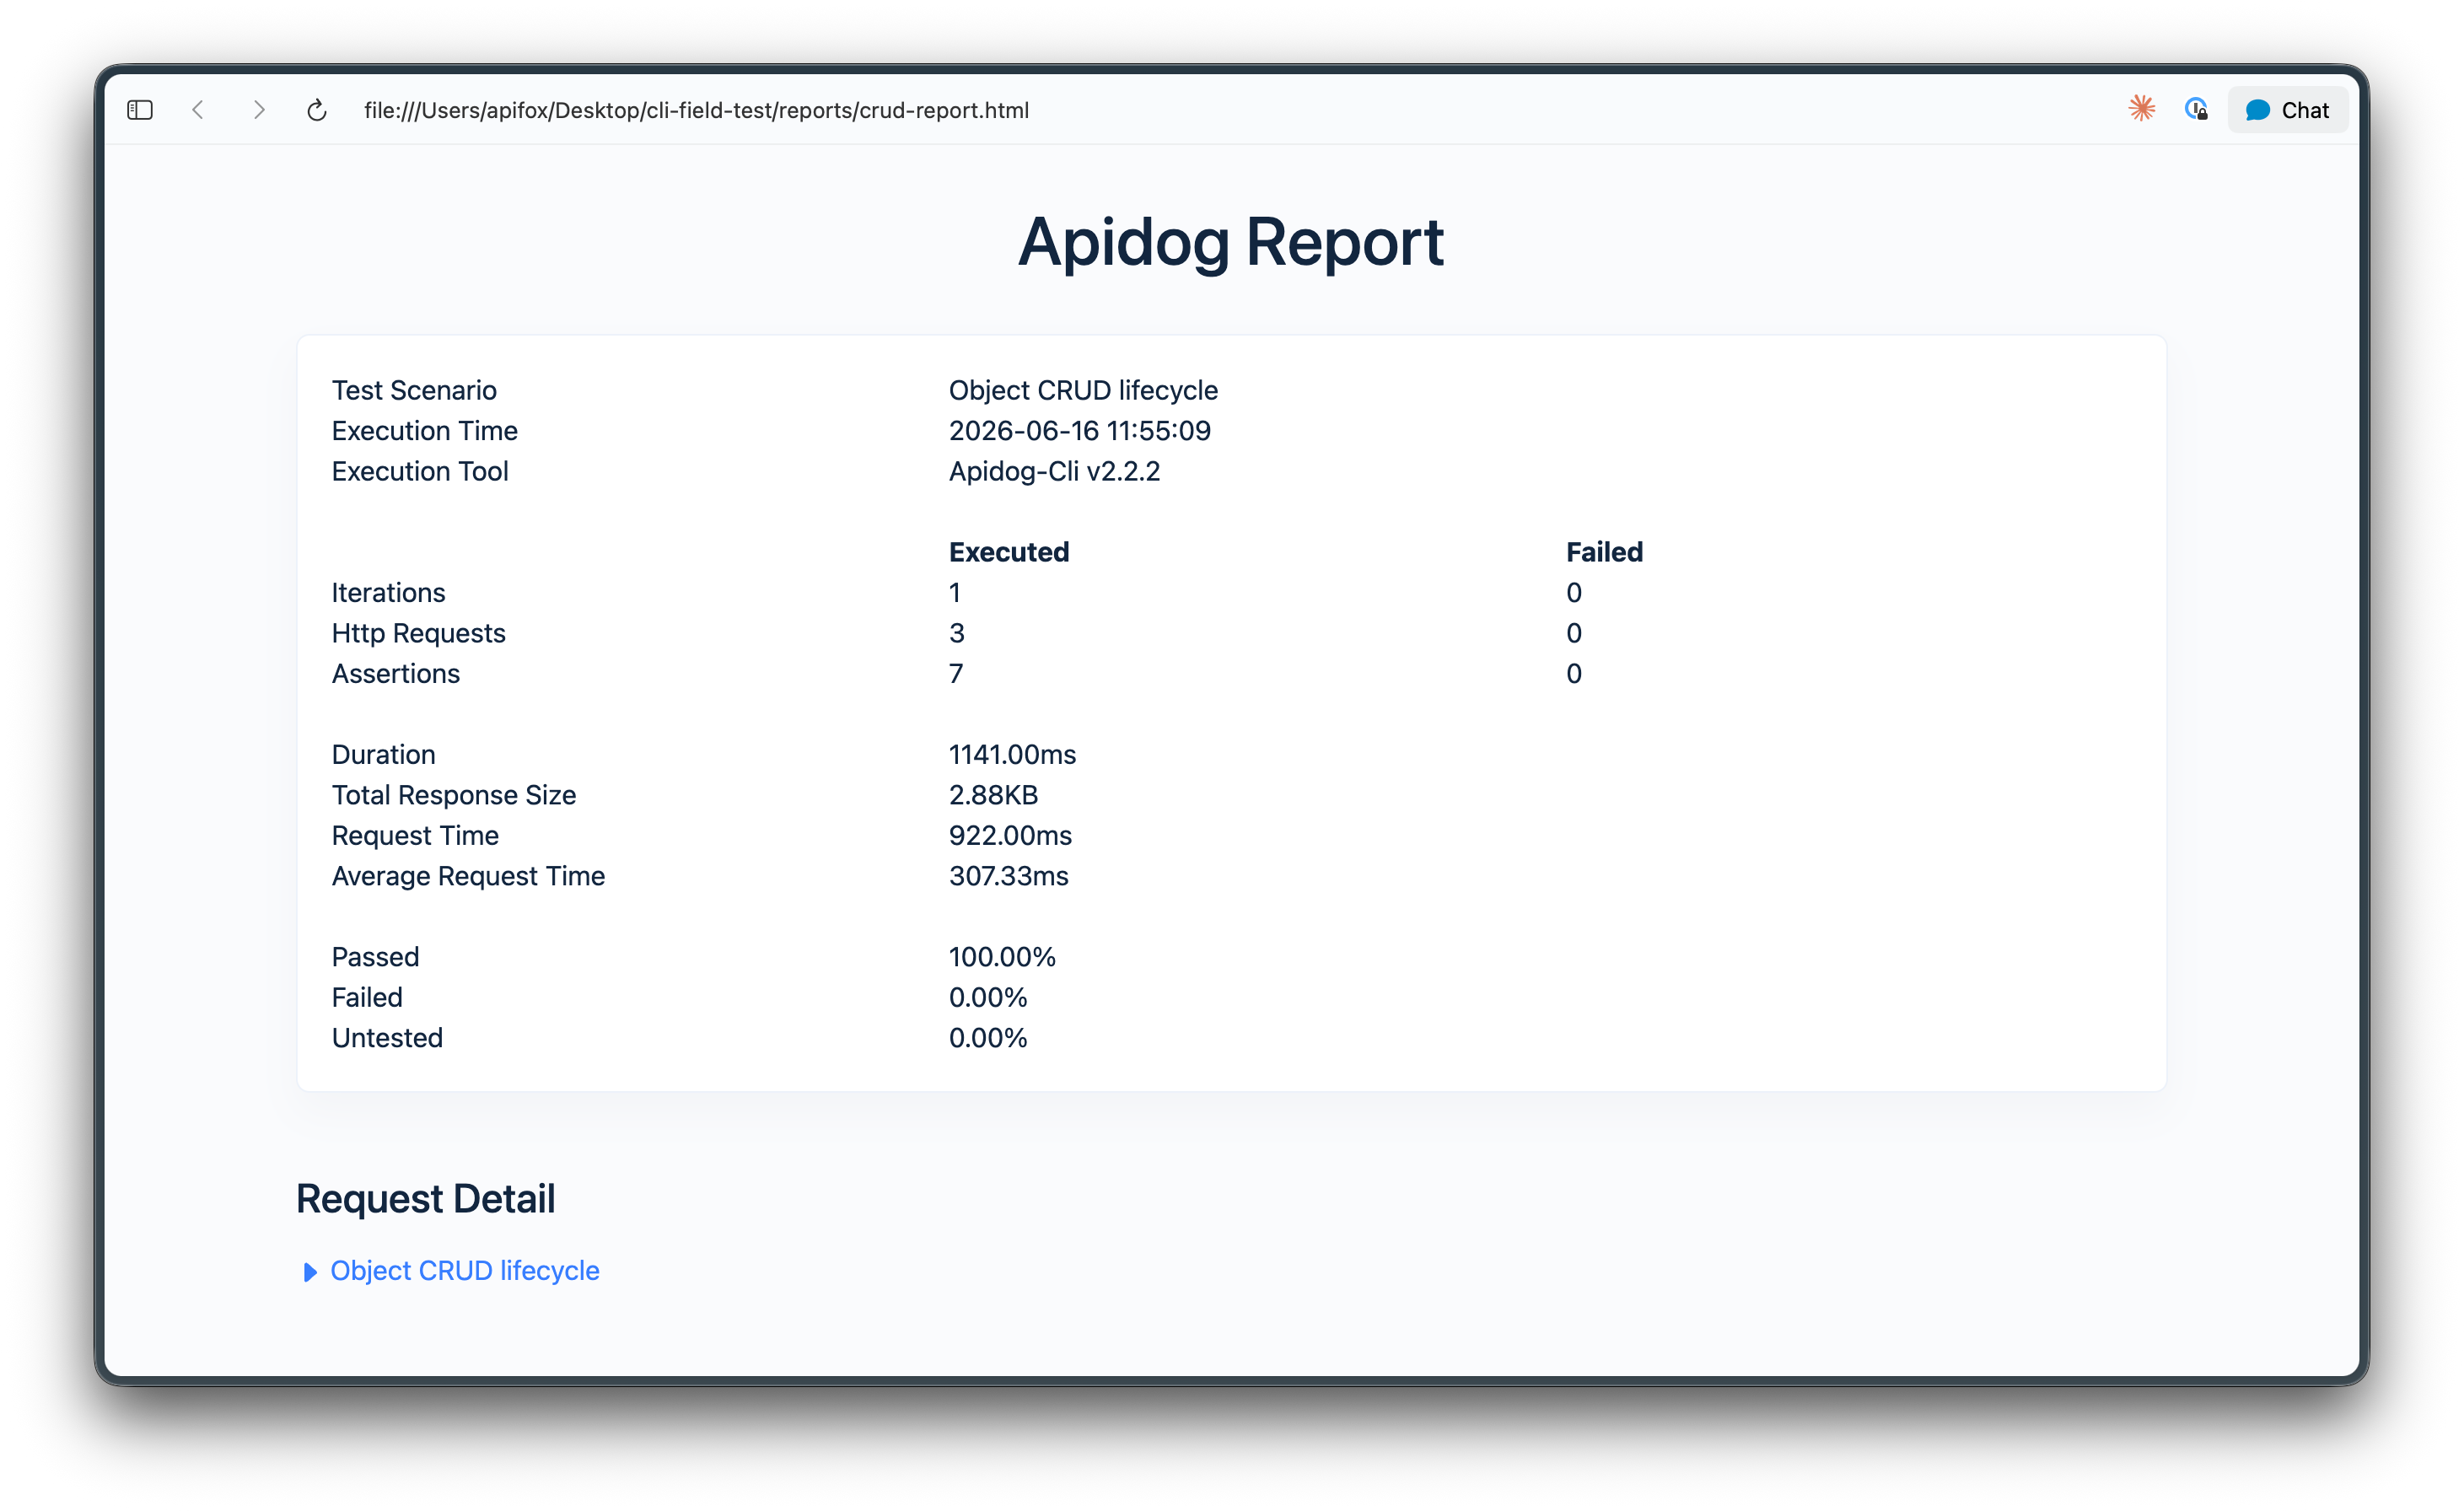
This is the format you archive and share. Save it as a build artifact and the report outlives the pipeline run, so a week later you can still open the exact report from the deploy that broke. It’s also what you send the person who asks “what failed?” without making them install the CLI or rerun anything. They open the file, see the red step, read the response body that tripped the assertion, and they’re done.
HTML earns its place most on a data-driven run. When one scenario loops over a CSV of fifty rows, the HTML report shows you the result per iteration, so you can see that rows 1 through 49 passed and row 50 failed because one account had a stale token. A pass or fail count alone can’t tell you that. If you run scenarios across data files, the pattern is covered in data-driven API testing with CSV and JSON.
The tradeoff: HTML is for eyes, not for parsing. Don’t try to scrape it for pass/fail status in a script. That’s what JSON and JUnit are for.
junit: the report your CI dashboard parses
The junit reporter emits XML in the standard JUnit format. That format matters because it’s the lingua franca of CI test reporting. Almost every CI system, GitHub Actions, GitLab CI, Jenkins, CircleCI, Azure Pipelines, knows how to read JUnit XML and turn it into a pass/fail tree, surface failures in a merge-request widget, and trend results across builds over time.
apidog run --access-token $APIDOG_ACCESS_TOKEN -t 605067 -e 1629989 -r junit --out-dir ./apidog-reports
If you pick exactly one machine format for CI, pick this one. The payoff is that your test results stop living only in a log file and start living in the dashboard your team already looks at. A reviewer opens a pull request and sees which assertions failed rendered inline, no log spelunking, no artifact download.
Wiring it up is two steps: produce the XML, then tell your CI system where to find it. In GitLab CI, that second step is the reports: junit: block:
api-tests:
  stage: test
  image: node:20
  script:
    - npm install -g apidog-cli
    - apidog run --access-token "$APIDOG_ACCESS_TOKEN" -t 605067 -e 1629989 -r junit,cli --out-dir ./apidog-reports
  artifacts:
    when: always
    paths:
      - apidog-reports/
    reports:
      junit: apidog-reports/*.xml
In Jenkins, the equivalent is the junit step in a post block pointed at the same files. In GitHub Actions, you upload the directory as an artifact and let a JUnit-aware action render it. The full GitHub workflow, including artifact upload that runs even when tests fail, lives in running Apidog CLI tests in GitHub Actions.
json: the report your scripts post-process
The json reporter produces the raw structured result. Where HTML is for eyes and JUnit is for dashboards, JSON is for code you write yourself.
apidog run --access-token $APIDOG_ACCESS_TOKEN -t 605067 -e 1629989 -r json --out-dir ./apidog-reports
Reach for it when the built-in formats don’t fit what you want to do with the result. Push pass-rate metrics to a monitoring system. Build a custom Slack summary. Feed the outcome into a script that decides whether to roll back a deploy. Diff today’s run against yesterday’s. Anything programmatic starts from the JSON, because it’s the format you can parse without guessing at structure.
One report flag is built specifically for the JSON output. --out-json-failures-separated <value> splits failures into their own JSON file. That gives you a failures-only document, which is far easier to read and to diff than scanning a full result for the handful of steps that broke. On a large regression sweep where most steps pass, a failures-only file is the difference between a glance and a grep.
Where the files land: --out-dir, --out-file, and placeholders
Choosing formats is half the picture. The other half is controlling where the files land and what they’re named, which matters the moment you keep more than one run’s worth of reports around.
--out-dir <dir> sets the directory reports are written to. The default is ./apidog-reports. In CI, point it somewhere your artifact step can find, and keep it consistent so your upload configuration never has to change:
apidog run --access-token $APIDOG_ACCESS_TOKEN -t 605067 -e 1629989 -r html,junit --out-dir ./apidog-reports
--out-file <name> sets the report filename, and this is where it gets useful. Without it, each run tends to overwrite the last, so you only ever keep the most recent report. The flag accepts placeholders that the runner fills in at write time:
{SCENARIO_NAME}becomes the name of the scenario that ran.{FOLDER_NAME}becomes the folder name when you run a folder of scenarios.{GENERATE_TIME}becomes a timestamp.
Stamp a filename with the scenario name and a timestamp and every run writes a distinct, self-describing file instead of clobbering the previous one:
apidog run --access-token $APIDOG_ACCESS_TOKEN -t 605067 -e 1629989 -r html --out-file "{SCENARIO_NAME}-{GENERATE_TIME}"
Now your reports directory reads like a history. You can tell which report came from which scenario and when it ran without opening a single file, which is exactly what you want when you’re scanning a folder of nightly runs to find the one where things first went wrong.
One more report flag rounds out the cloud side. --upload-report [value] uploads a report overview to the Apidog cloud, so the run also shows up in your project’s history alongside the local files. It’s the option to reach for when you want the result visible inside Apidog itself, not only as a file on the CI runner.
A reporter strategy by audience
The cleanest way to decide is to map each reporter to who reads it, then pass the ones you need together.
- A person scanning the build log right now reads
cli. Always include it. - A person opening a saved report later reads
html. Archive it as an artifact. - The CI dashboard reads
junit. It’s what renders failures in the merge request and trends results over builds. - A script you wrote reads
json. It’s the only format meant to be parsed by your own code.
For most CI pipelines, the workhorse combination is HTML for humans plus JUnit for the dashboard, with CLI kept on so the raw log stays readable:
apidog run --access-token $APIDOG_ACCESS_TOKEN -t 605067 -e 1629989 -r cli,html,junit --out-dir ./apidog-reports
That one run produces a readable log, a browsable artifact, and a parseable XML file. Three audiences, one execution, no duplication.
One caution worth stating plainly: the report tells you what happened, but the exit code is what makes the pipeline act on it. The Apidog CLI exits non-zero when any assertion fails, and that exit code, not the report, is what fails the build and blocks the merge. The report explains the failure; the exit code enforces it. Don’t wrap the command in anything that swallows that code, like appending || true in a shell, or you’ll get a perfect red report attached to a build that still went green. The deeper version of that quality-gate logic is in the guide to automating API tests in CI/CD.
Putting it together
Run a scenario in CI and emit all three useful artifacts for three audiences:
apidog run --access-token $APIDOG_ACCESS_TOKEN -t 605067 -e 1629989 -n 1 -r cli,html,junit --out-dir ./apidog-reports
Run a nightly folder sweep, collect every failure in one report, and give each file a self-describing name:
apidog run --access-token $APIDOG_ACCESS_TOKEN -f 88012 -r html,junit --on-error continue --out-dir ./nightly-reports --out-file "{FOLDER_NAME}-{GENERATE_TIME}"
Run a data-driven scenario and keep a failures-only JSON for quick diffs:
apidog run --access-token $APIDOG_ACCESS_TOKEN -t 605067 -d ./accounts.csv -r json --out-json-failures-separated true --out-dir ./apidog-reports
If you’d rather not install the CLI globally on an ephemeral runner, swap the install for npx and keep the same reporter flags:
npx apidog-cli run --access-token $APIDOG_ACCESS_TOKEN -t 605067 -e 1629989 -r html,junit --out-dir ./apidog-reports
The reporter behavior is identical either way; the choice between a global install and npx is about runner hygiene, not about what reports you get.
Flag names, defaults, and reporters can change between CLI releases, so the runner is always its own source of truth. Run apidog run --help on the version you have installed and trust that over any article, including this one. To set up the scenario the CLI runs in the first place, Download Apidog, build one scenario in the app, then copy the generated command from its CI/CD tab and add the reporters you need.