
Welcome to the world of Jest Debug, where testing meets seamless debugging! If you're a developer working with JavaScript, you've probably encountered Jest—a delightful testing framework that's both powerful and user-friendly. But, have you ever found yourself lost in a sea of console logs while trying to track down that elusive bug? Enter Jest Debug, your new best friend.
In this post, we'll dive deep into the world of Jest Debug. We'll cover everything from the basics to advanced techniques, ensuring you have all the tools you need to debug your tests effectively. Along the way, we'll also explore how Jest Debug integrates with other tools like API testing and Apidog. So, buckle up and get ready for a smoother, more efficient debugging experience!
Why Debugging Matters in Testing
Before we jump into the specifics of Jest Debug, let's take a moment to understand why debugging is crucial in the testing process. Testing is all about ensuring that your code works as expected. However, when tests fail, it's not always immediately clear why. This is where debugging comes in. Debugging allows you to step through your code, inspect variables, and understand the flow of execution. By doing so, you can pinpoint the exact location and cause of errors.
Getting Started with Jest Debug
Let's start with the basics. Jest Debug is a feature of the Jest testing framework that allows you to debug your tests using your preferred debugger, such as Chrome DevTools or Visual Studio Code.
Setting Up Jest Debug
To set up Jest Debug, you'll need to have Jest installed in your project. If you haven't done this yet, you can install Jest using npm or yarn:
npm install --save-dev jest
# or
yarn add --dev jest
Next, you'll need to configure Jest to run in debug mode. This can be done by adding a debug script to your package.json file:
"scripts": {
  "test": "jest",
  "test:debug": "node --inspect-brk node_modules/.bin/jest --runInBand"
}
The --inspect-brk flag tells Node.js to start in debug mode and break before the first line of the code is executed. The --runInBand flag ensures that Jest runs tests sequentially, which is important for debugging.
Running Jest in Debug Mode
To run Jest in debug mode, simply use the debug script you added to your package.json:
npm run test:debug
# or
yarn test:debug
This will start your tests in debug mode. You can then open your debugger of choice (e.g., Chrome DevTools or Visual Studio Code) and start debugging.
Debugging with Chrome DevTools
Chrome DevTools is a powerful tool that comes with Google Chrome. It provides a range of features for debugging JavaScript applications, including the ability to set breakpoints, inspect variables, and step through code.
Connecting to Chrome DevTools
To connect to Chrome DevTools, open Chrome and navigate to chrome://inspect. You should see your Node.js process listed under "Remote Target". Click on "inspect" to open DevTools.
Setting Breakpoints and Stepping Through Code
Once DevTools is open, you can set breakpoints by clicking on the line numbers in the Sources panel. You can also use the "Step over", "Step into", and "Step out" buttons to control the execution of your code. This allows you to follow the flow of your tests and understand what's happening at each step.
Debugging with Visual Studio Code
Visual Studio Code (VS Code) is a popular code editor that includes built-in support for debugging JavaScript. It provides an integrated debugging experience, allowing you to set breakpoints, inspect variables, and more.
Setting Up VS Code for Jest Debugging
To set up VS Code for Jest debugging, you'll need to create a launch configuration. This can be done by adding a launch.json file to your .vscode directory:
{
  "version": "0.2.0",
  "configurations": [
    {
      "type": "node",
      "request": "launch",
      "name": "Jest Debug",
      "program": "${workspaceFolder}/node_modules/.bin/jest",
      "args": [
        "--runInBand"
      ],
      "console": "integratedTerminal",
      "internalConsoleOptions": "neverOpen"
    }
  ]
}
Running and Debugging Tests
With the launch.json file in place, you can start debugging by opening the Debug panel in VS Code and selecting "Jest Debug" from the configuration dropdown. Then, click the green play button to start debugging.
VS Code will launch Jest in debug mode, and you can set breakpoints, inspect variables, and step through your code just like in Chrome DevTools.
Integrating Jest Debug with API Testing
Now that you have a solid understanding of how to use Jest Debug, let's explore how it can be integrated with API testing. API testing is crucial for ensuring that your application's backend services work correctly. By using Jest Debug, you can make your API tests more robust and easier to troubleshoot.
Writing API Tests with Jest
Jest provides excellent support for testing APIs, especially when combined with libraries like axios or supertest. Here's a simple example of how to write an API test using Jest and axios:
const axios = require('axios');

test('should fetch data from API', async () => {
  const response = await axios.get('https://api.example.com/data');
  expect(response.status).toBe(200);
  expect(response.data).toEqual({ key: 'value' });
});
Debugging API Tests
When debugging API tests, you can use the same techniques we've discussed so far. Set breakpoints in your test code or in the code that makes the API requests, and step through the execution to understand what's happening.
Integrating Apidog with Jest Debug
Apidog is a powerful tool for API design, development, and testing. It provides a range of features that can help you create and manage your APIs more effectively. By integrating Apidog with Jest Debug, you can streamline your API testing workflow and make debugging easier.
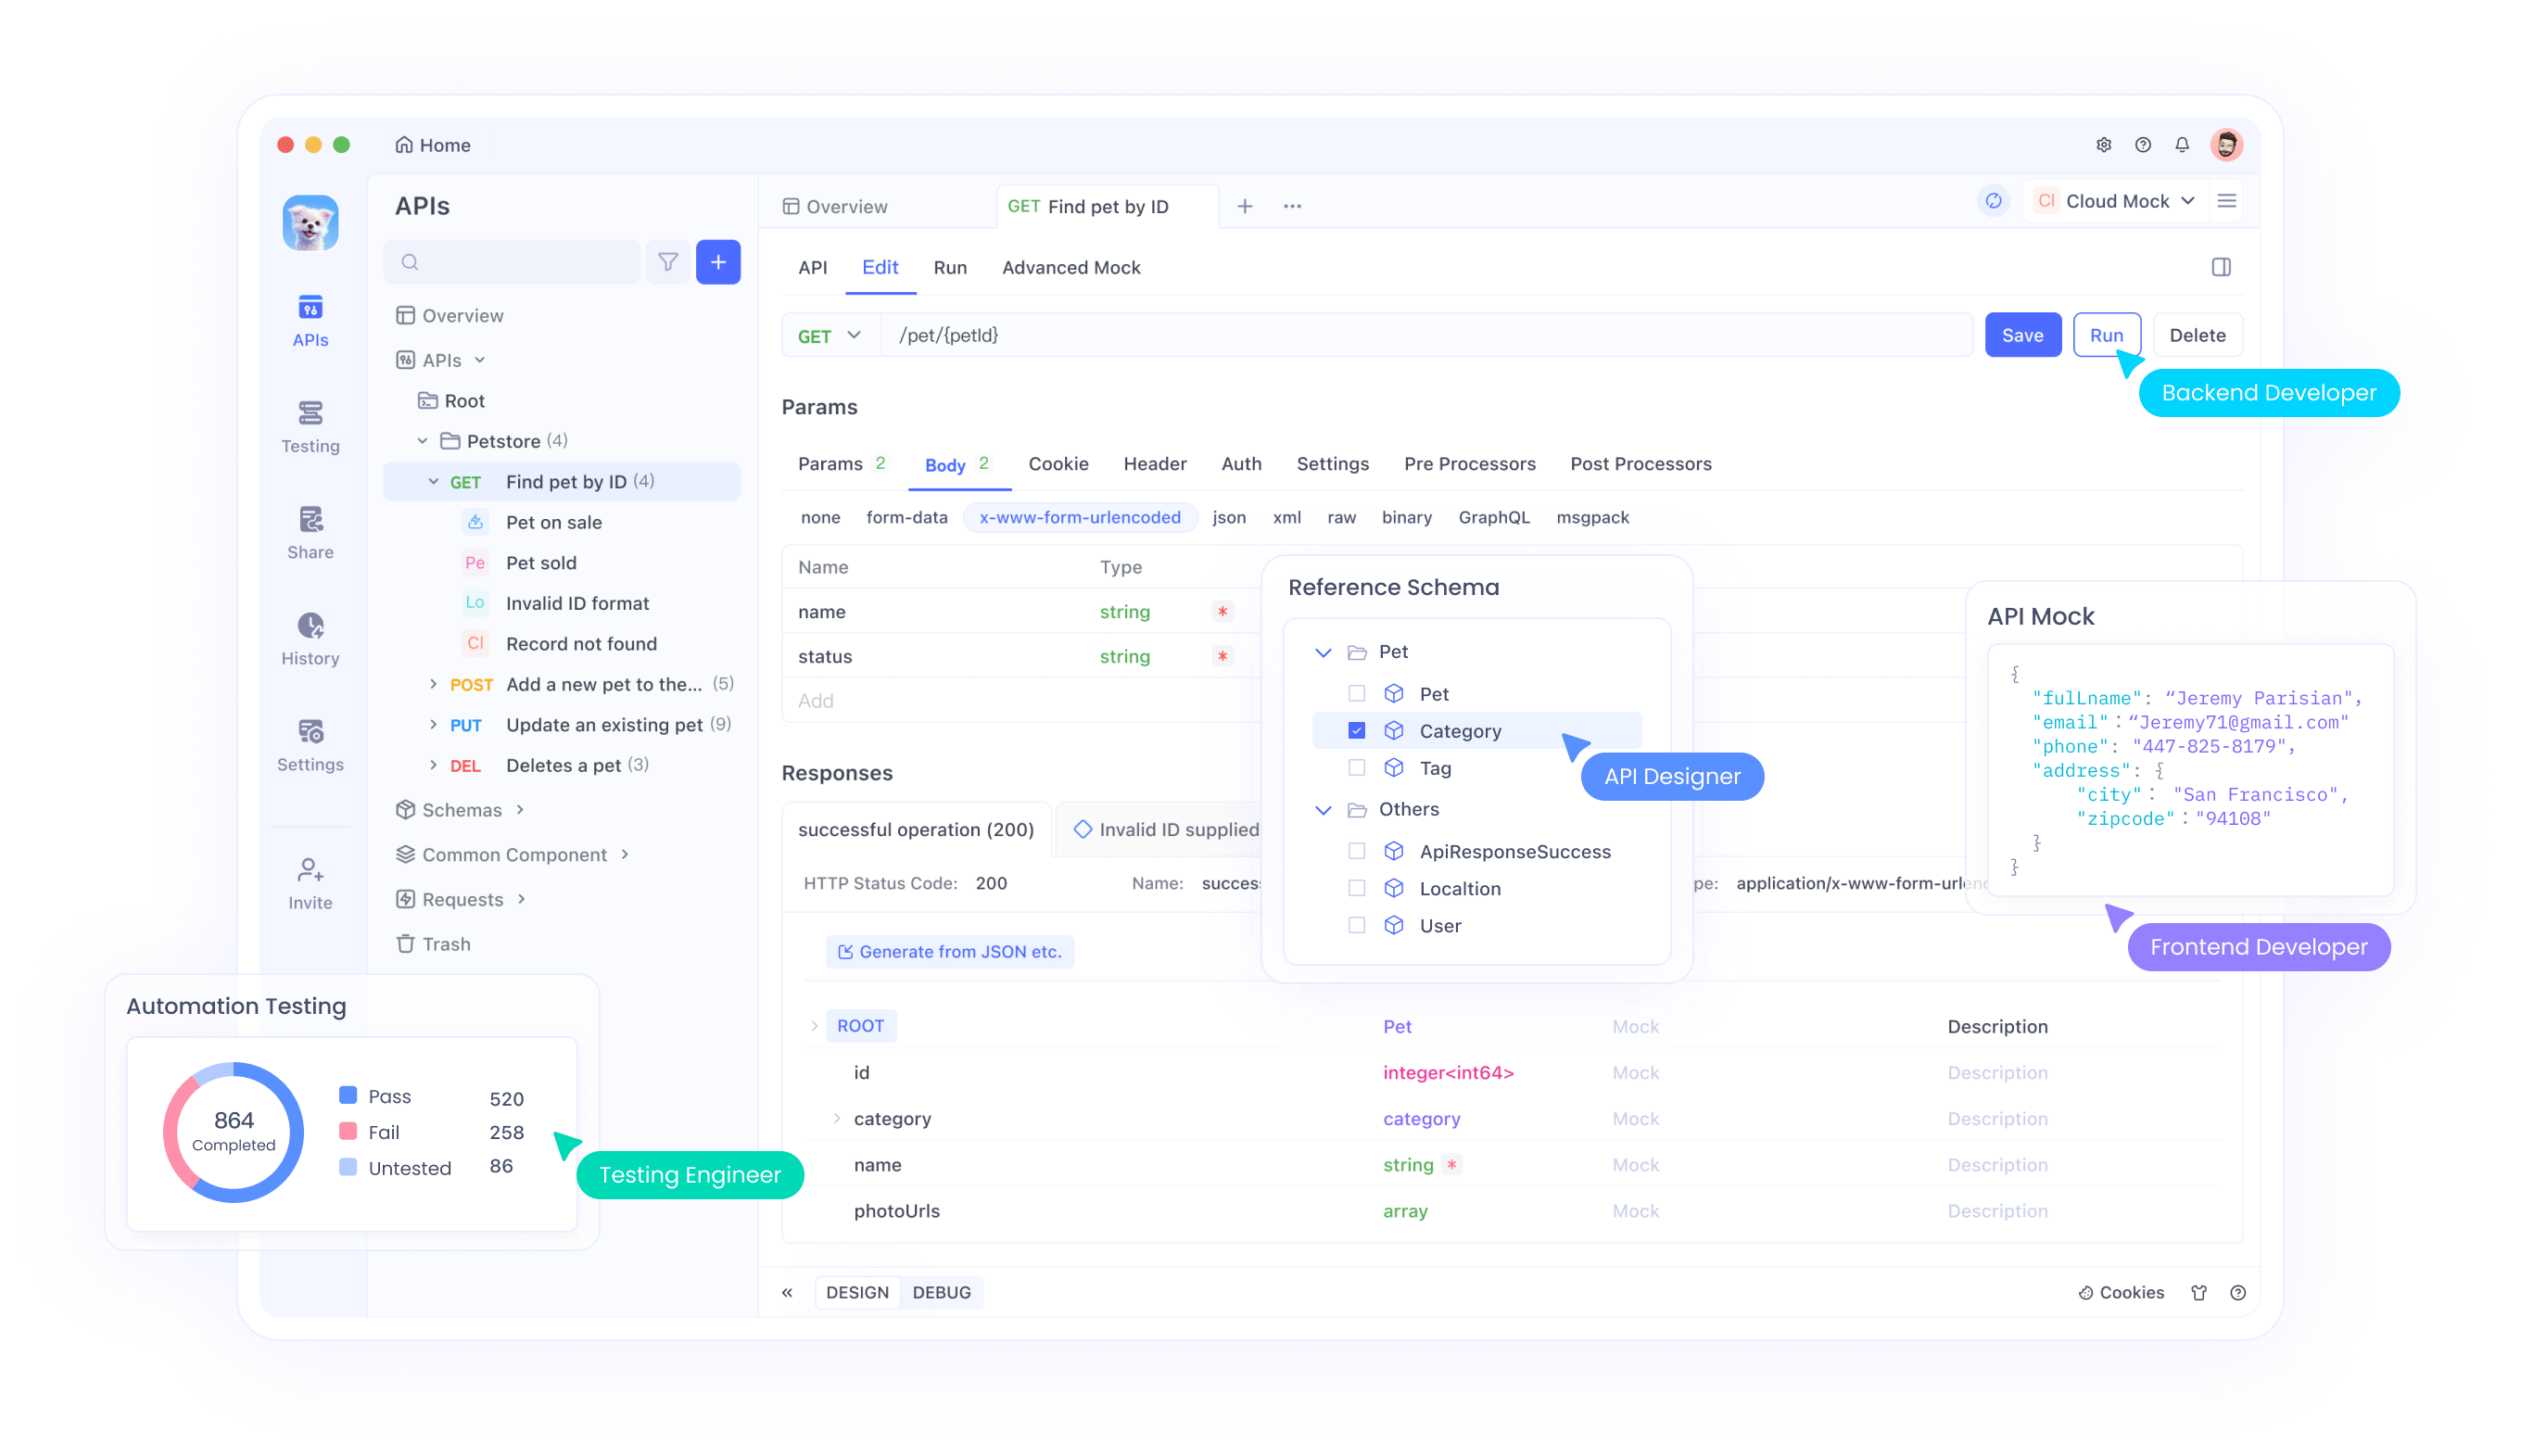
Debugging with Apidog is easy. Once enter the details of your API, including the endpoint and request parameters, you can easily inspect the response and debug your API with the debug mode.
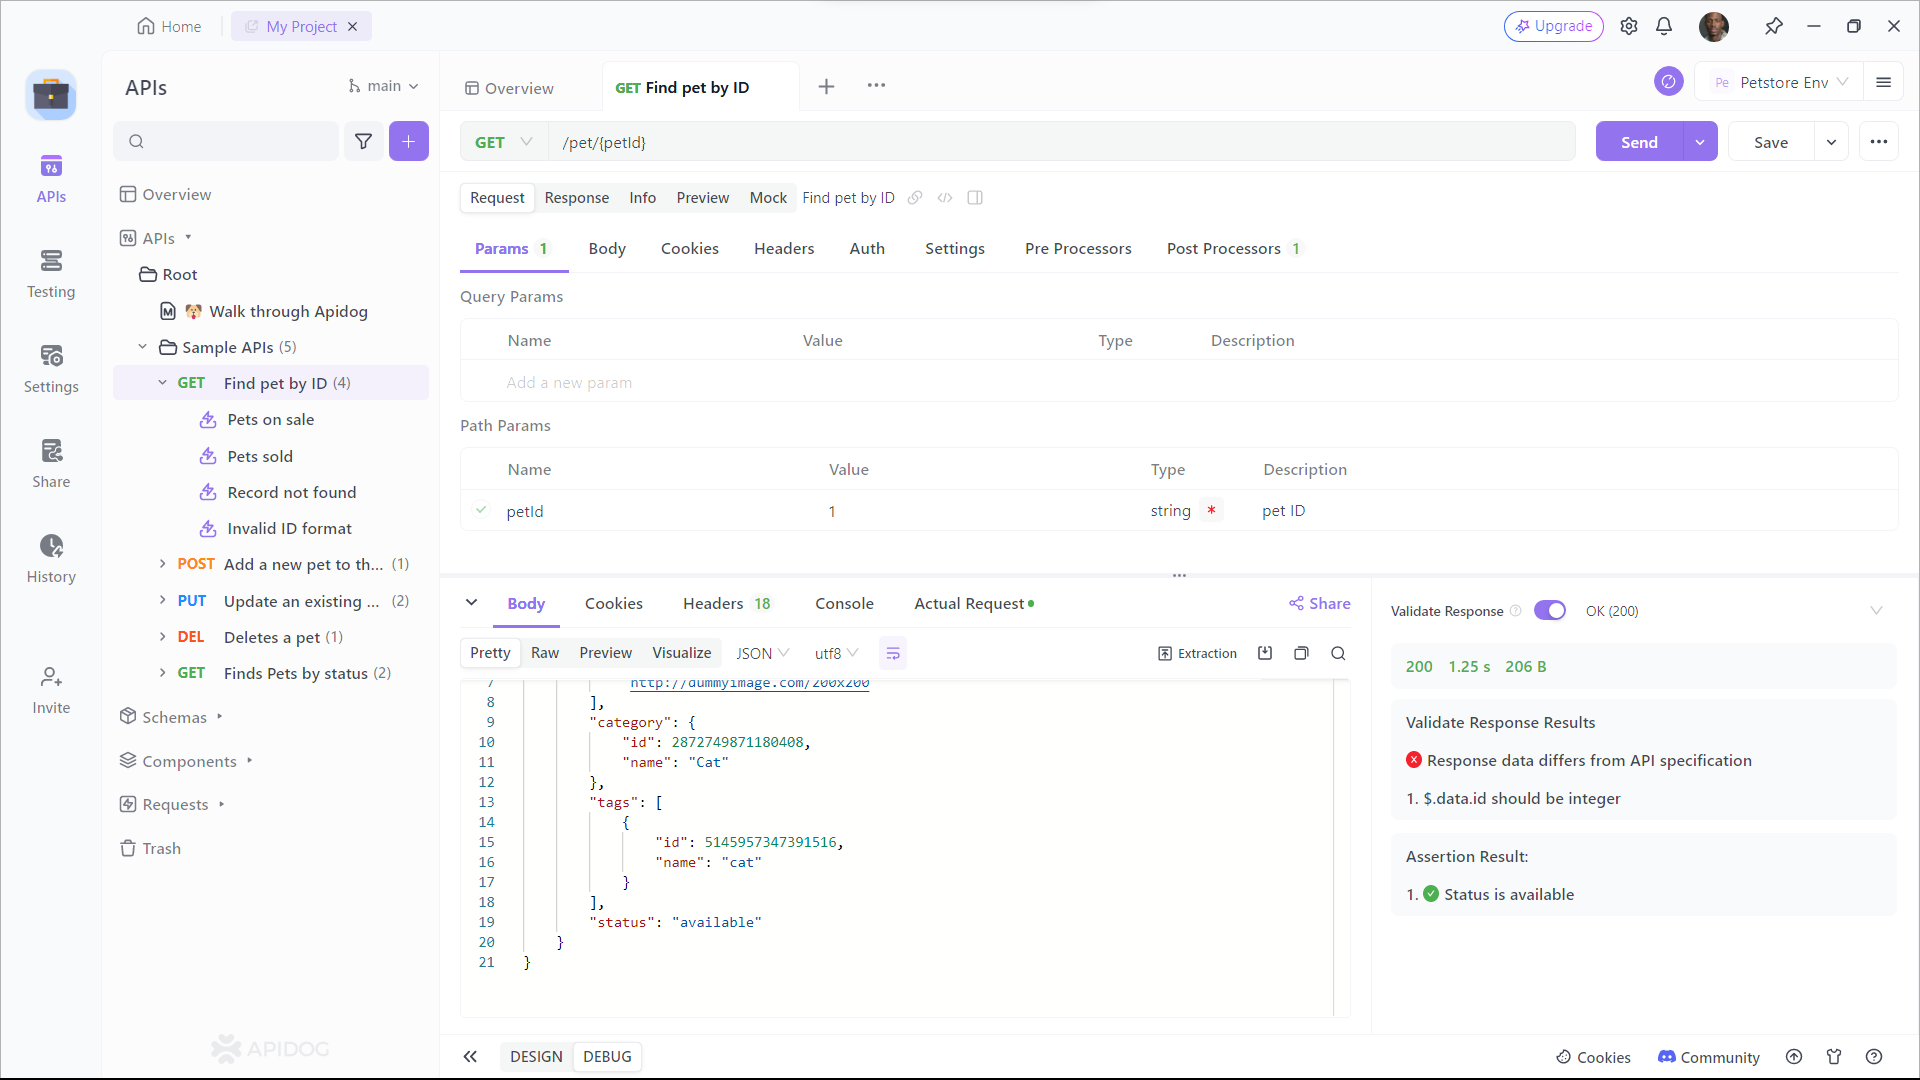
In addition to inspecting requests, Apidog enables you to manipulate API responses. This feature is particularly useful when testing error handling or edge cases in your code. With Apidog, you can modify the response data, status codes, or headers to simulate different scenarios and ensure your code behaves correctly under various conditions. By manipulating API responses, you can thoroughly test your code and catch potential bugs before they reach production.
Advanced Jest Debug Techniques
Now that we've covered the basics, let's explore some advanced techniques for using Jest Debug.
Conditional Breakpoints
Sometimes, you only want to break when certain conditions are met. Both Chrome DevTools and VS Code support conditional breakpoints. To set a conditional breakpoint, right-click on a breakpoint and select "Edit breakpoint" (in Chrome DevTools) or "Edit Condition" (in VS Code). Then, enter the condition that should trigger the breakpoint.
Debugging Asynchronous Code
Asynchronous code can be challenging to debug, but Jest Debug makes it easier. When debugging asynchronous tests, use the await keyword to ensure that breakpoints are hit at the right time. You can also use the "async" and "await" keywords to control the flow of execution.
Using Debugger Statements
In addition to setting breakpoints in your debugger, you can use the debugger statement in your code. When the JavaScript engine encounters a debugger statement, it will pause execution and open the debugger. This can be useful for setting breakpoints programmatically.
Conclusion
Jest Debug is a powerful tool that can significantly improve your testing and debugging workflow. By leveraging the capabilities of Chrome DevTools and VS Code, you can gain deeper insights into your tests and quickly identify and fix issues. Integrating Jest Debug with API testing and tools like Apidog can further enhance your productivity and ensure that your applications are robust and reliable.
So, the next time you're struggling with a failing test, remember to reach for Jest Debug. Happy debugging!


