![[Postman] How to Open the Postman Console?](https://assets.apidog.com/blog-next/2026/02/postman-open-console.png)
Have you encountered a moment where you cannot pinpoint the source of an error in your Postman API? This is when you should consider learning how to open the Postman console!
Consider using this free, comprehensive API tool today by clicking the button below.
What is Postman?
Postman is an API tool that many developers choose for solving their API-related needs. It is known for its capabilities to build, test, and document APIs. Overall, Postman simplifies API development, making it easy for humans to understand all the background processes that is involved in APIs.

What is the Postman Console Used For?
The Postman Console is essentially a developer console designed specifically for working with APIs within Postman. It functions similarly to the consoles you might find in web browsers like Chrome or Firefox, but with features tailored to debugging and analyzing API interactions.
Debugging API Requests
The Postman console displays detailed information about each request that is sent. It will include:
- Request and response headers
- Request body content
- Response body content
- Status codes
- Network information (like timestamps and durations)
- Any output messages from your pre-request or test scripts
Inspecting Script Output
The Postman console displays the output of these scripts, allowing developers to verify that the scripts are manipulating data or handling tasks correctly before the request is sent.
Verifying Certificates
The Postman console can be used to confirm that the correct SSL certificate is sent to the server, ensuring secure communication and avoiding potential certificate-related errors.
Step-by-step Guide to Open the Postman Console
Step 1 - Create a Postman Account
Create a new Postman account (only if you do not have one) and start downloading the Postman application onto your device. The application offers more features than its web version.
Step 2 - Create a New API Request on Postman
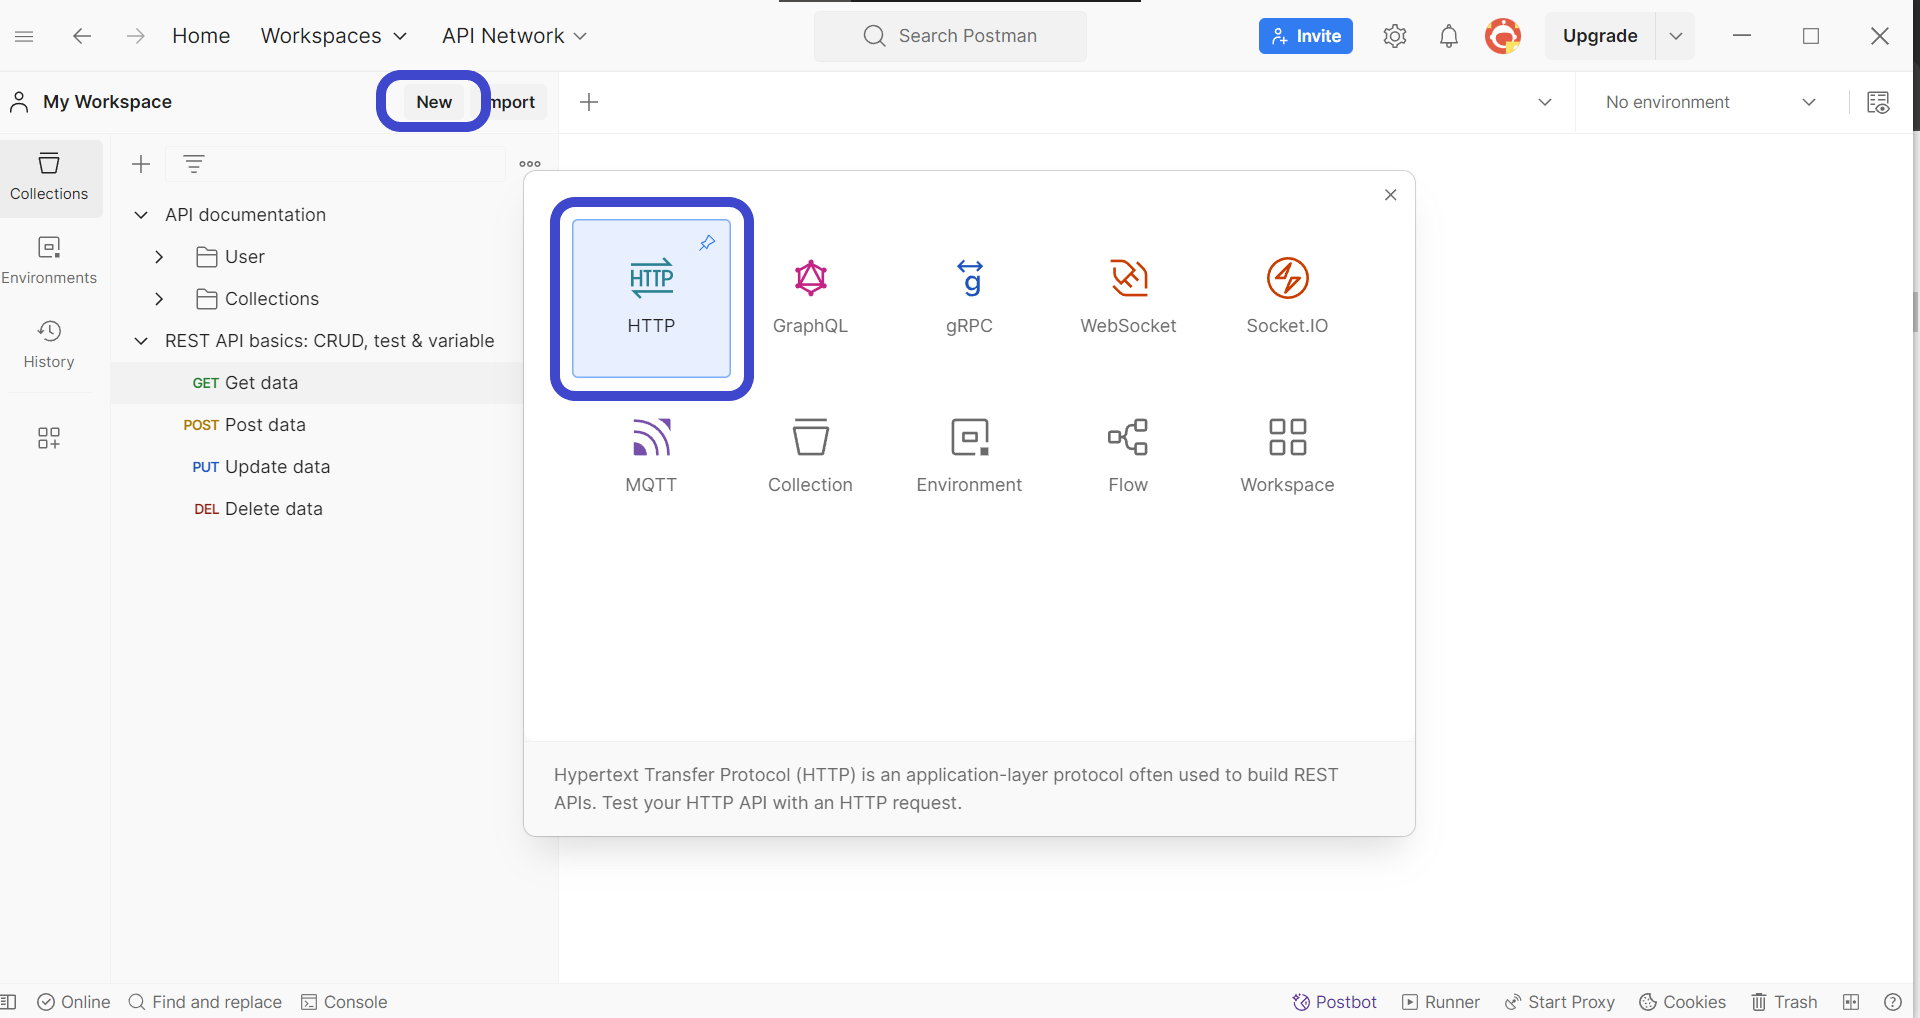
Once you have installed Postman, create a new request by clicking the New button in the top left corner of the Postman window. Select HTTP Request to create a new request, as shown in the image above.
Step 3 - Enter API Method and Details
Next, you need to include the details of the API request you wish to create. It must include components such as the URL, HTTP methods, and additional parameters the API will require.
Step 4 - Send API Request
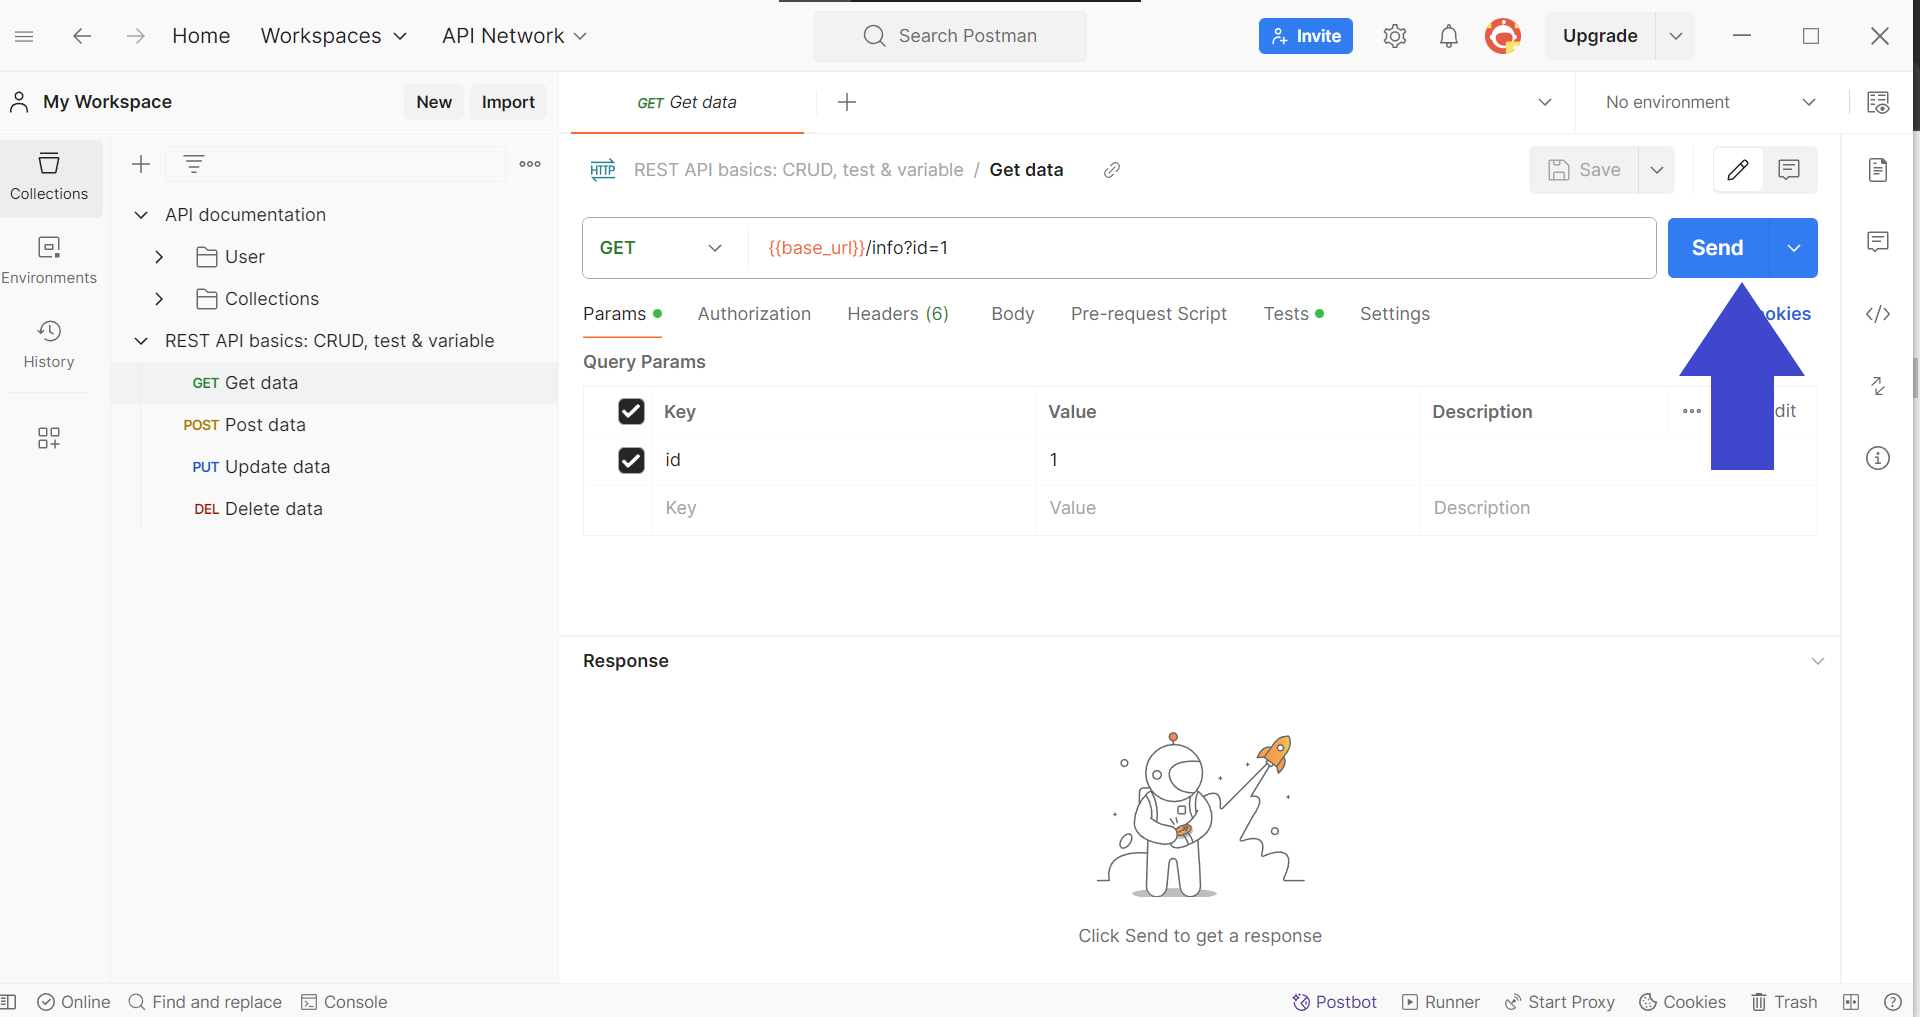
Press the Send button on the top right corner to send the API request in order to receive a response from the back end.
Step 5 - Open the Postman Console
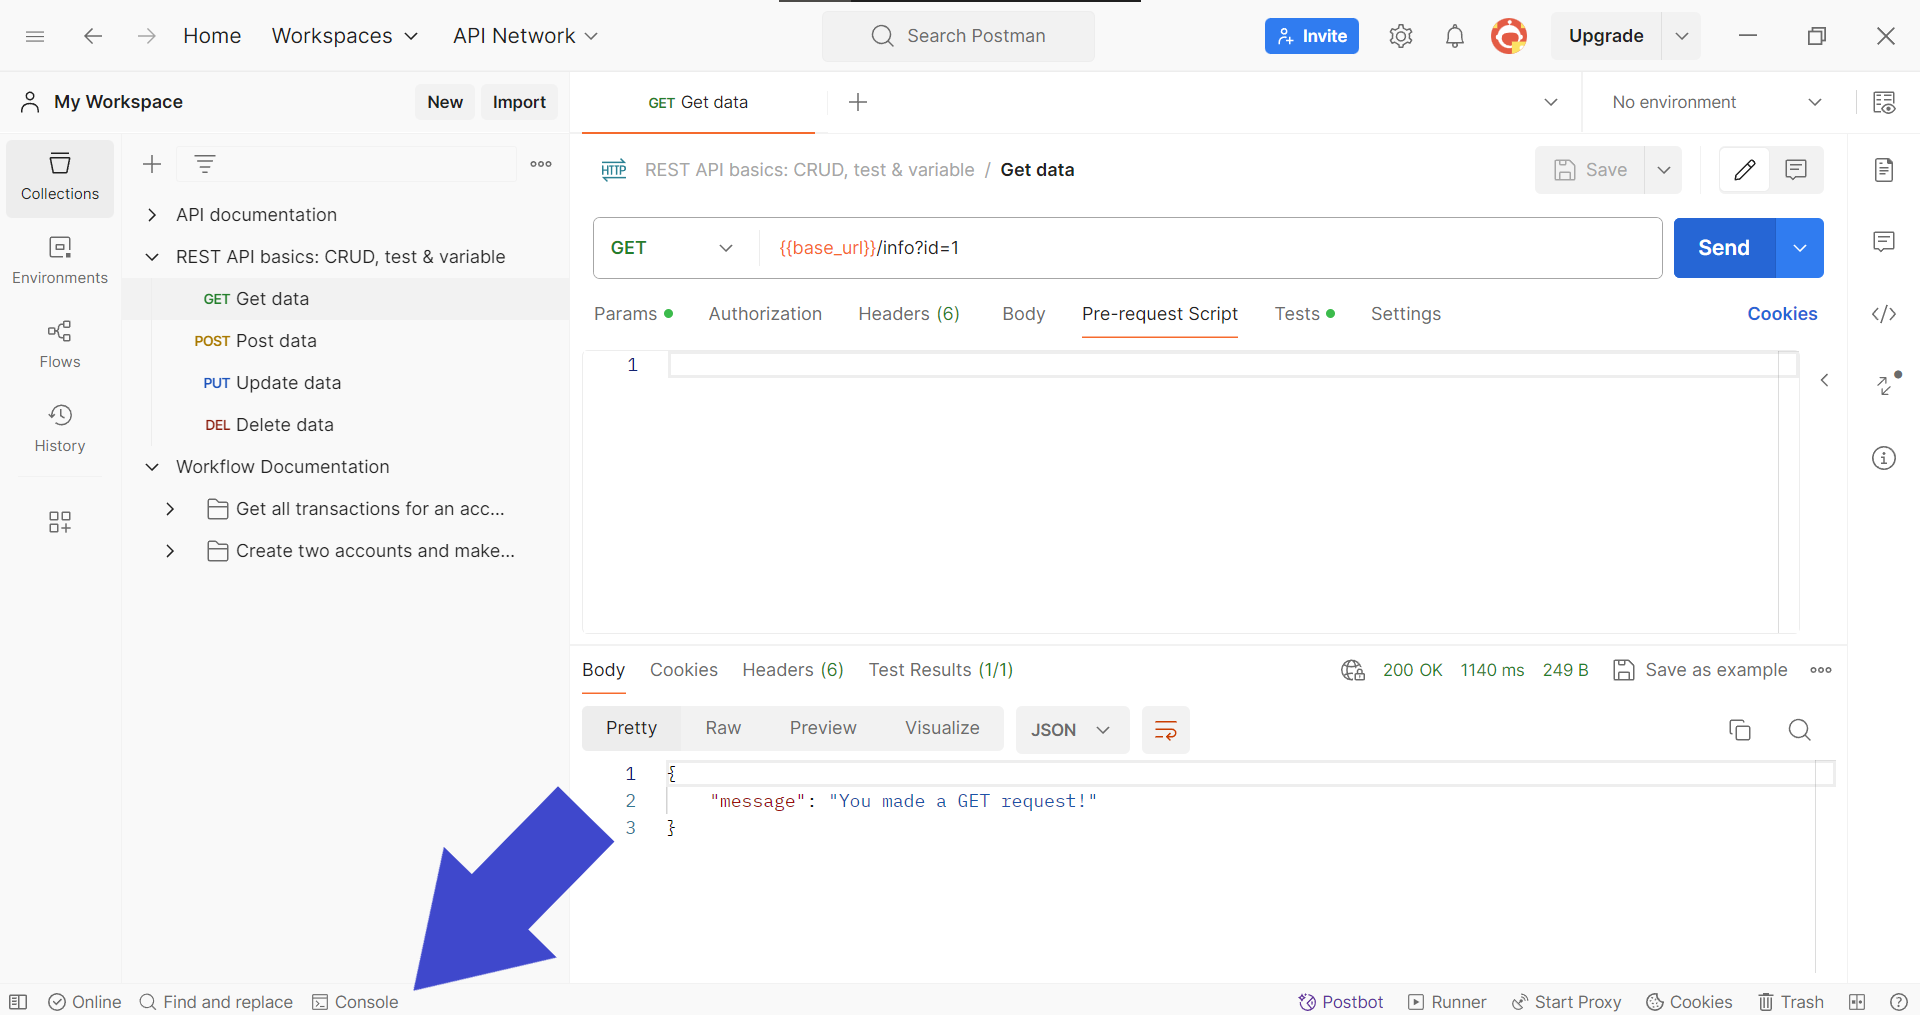
To observe the API response with closer detail, locate the Console button on the bottom left corner of the Postman application window, as shown in the image above. You can also use keyboard shortcuts to do so:
- MacOS users:
⌘+Option+C - Windows users:
Ctrl+Alt+C
Step 6 - Expand API Response Details in the Postman Console
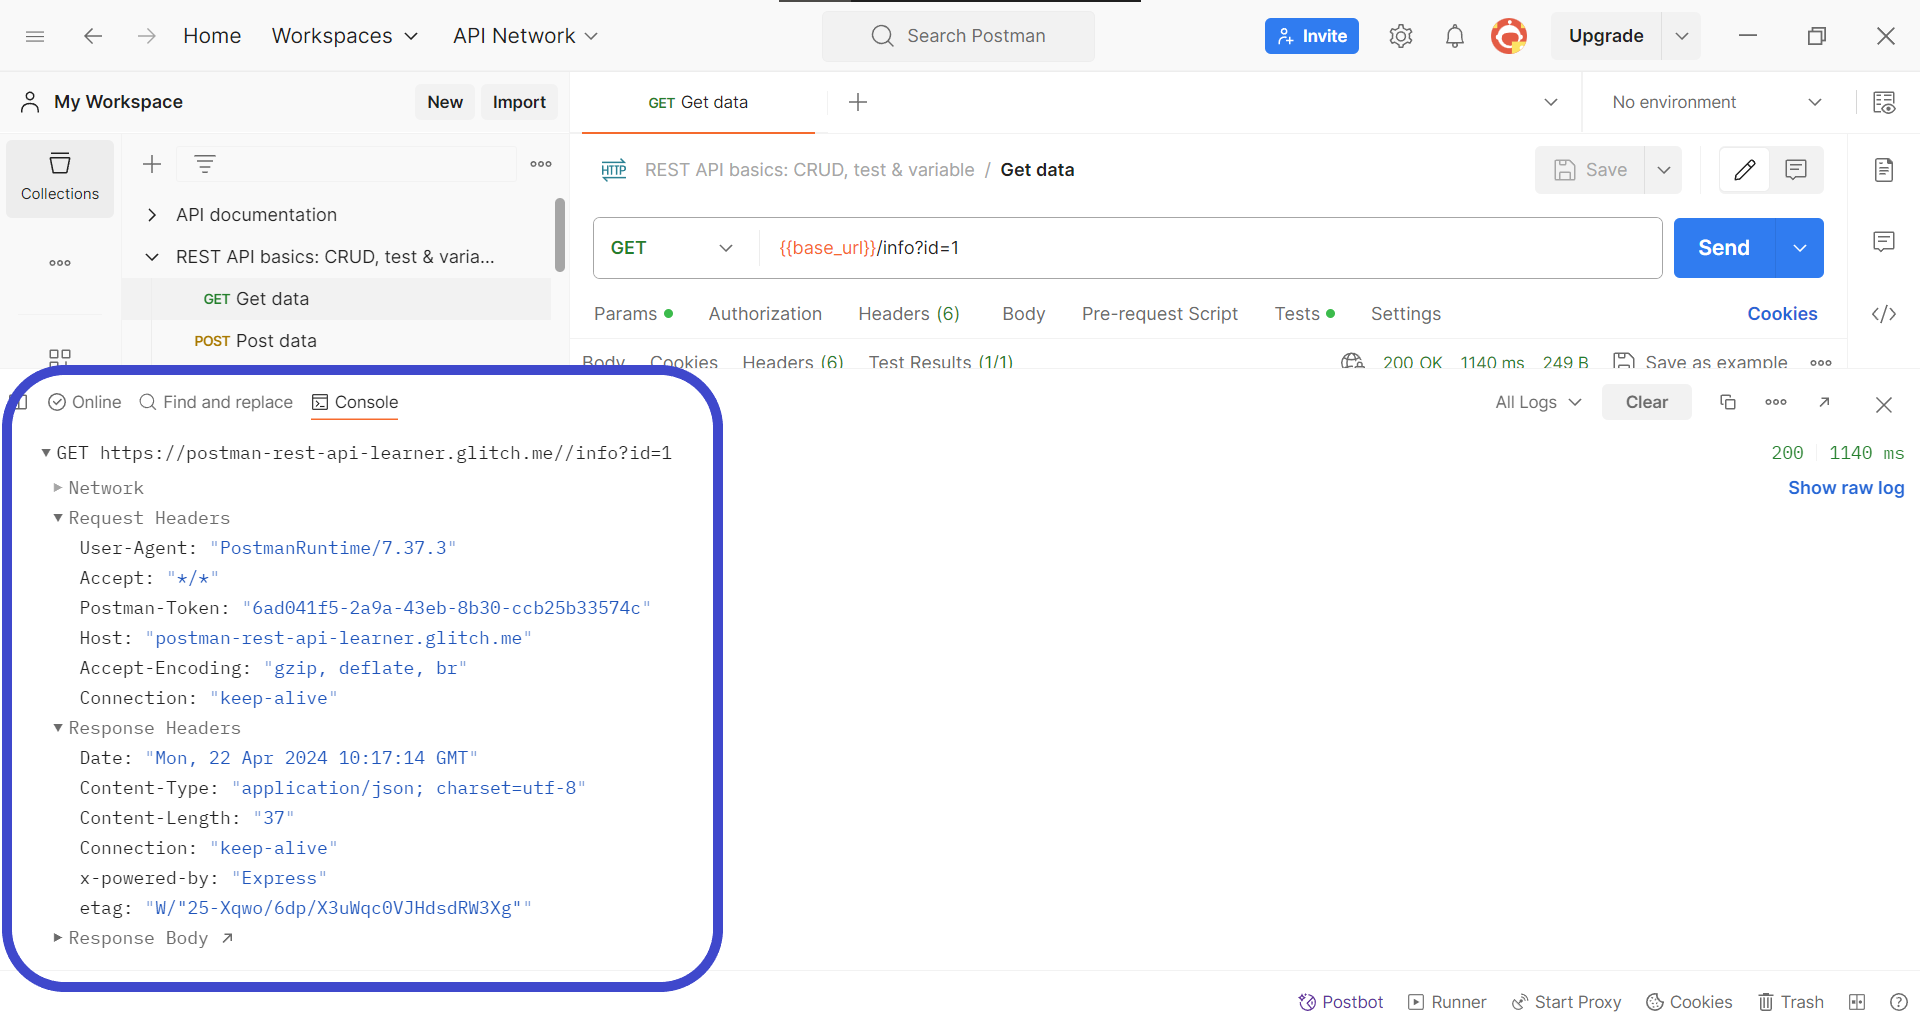
Expand the details of the API response by clicking on the response headers found within the Postman console section. This should enlighten you with the necessary details for troubleshooting your API.
Apidog - Gain Full Transparency of Your API
Apidog is an API development platform equipped with all the necessary functionalities needed for developing any stage of an API's lifecycle.
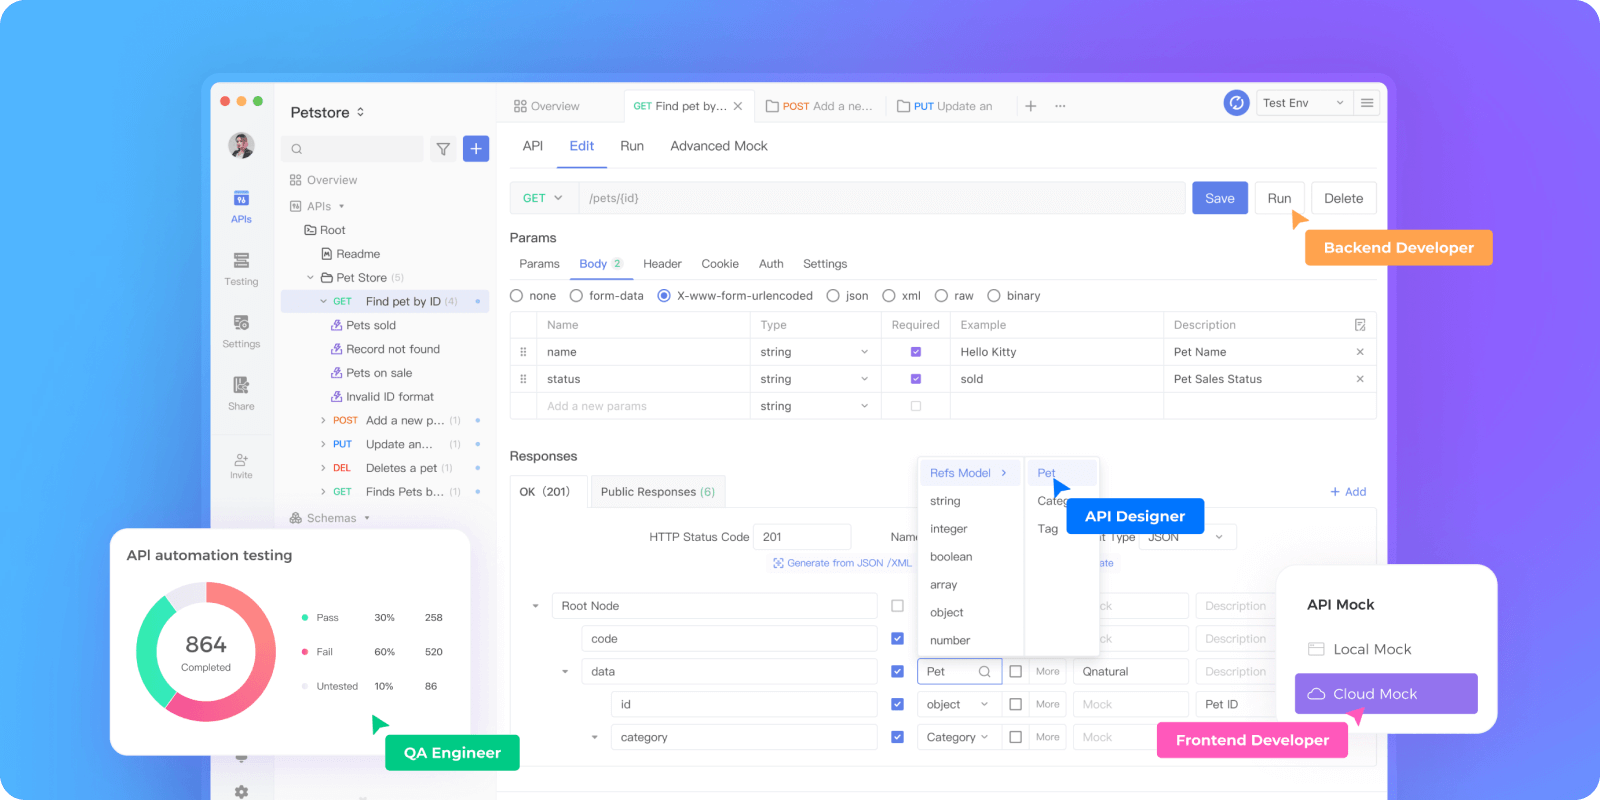
Apidog is surfacing as one of the best alternatives to Postman due to how easy and intuitive its user interface is, so if you are looking for a fresh platform to accommodate your API development, consider Apidog.
Build an API Swiftly with Apidog
Apidog's design-first approach allows developers, especially those with a visual preference, to quickly set up APIs. Apidog handsomely rewards developers who have prepared their APIs thoroughly!
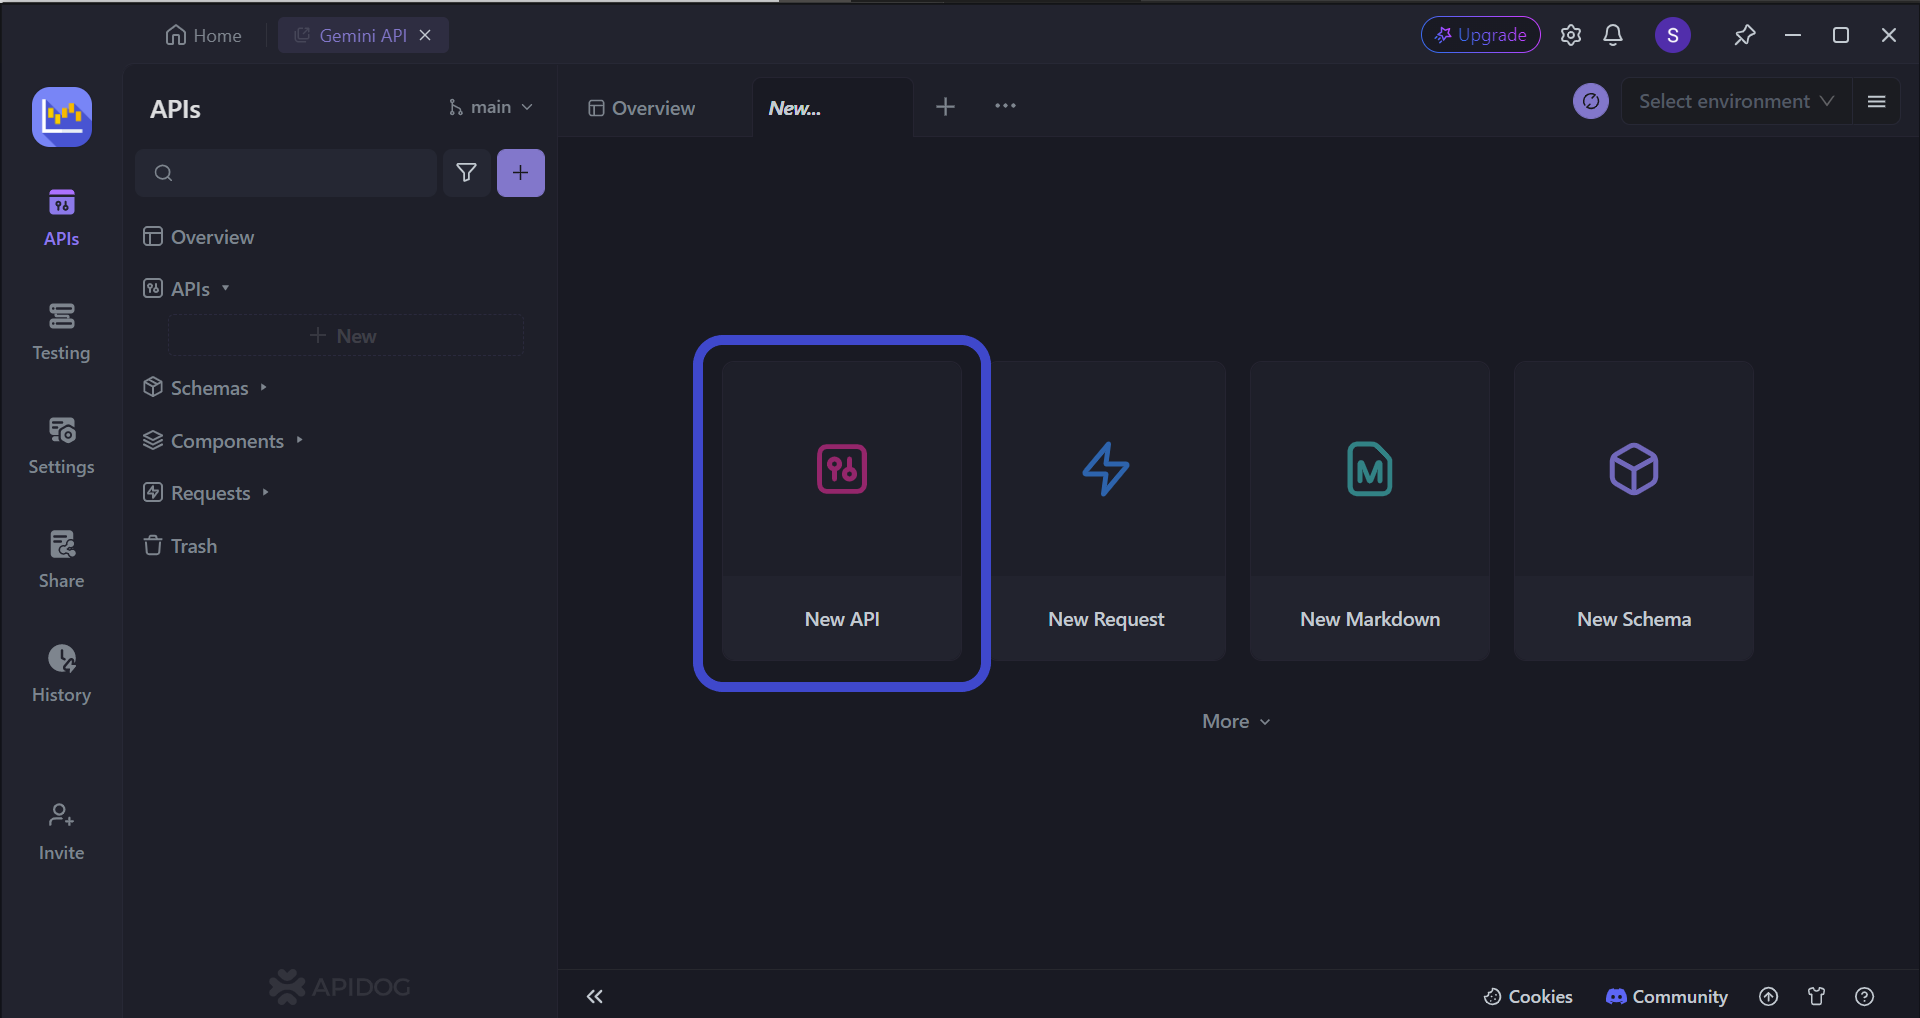
To begin, press the New API button, as shown in the image above.
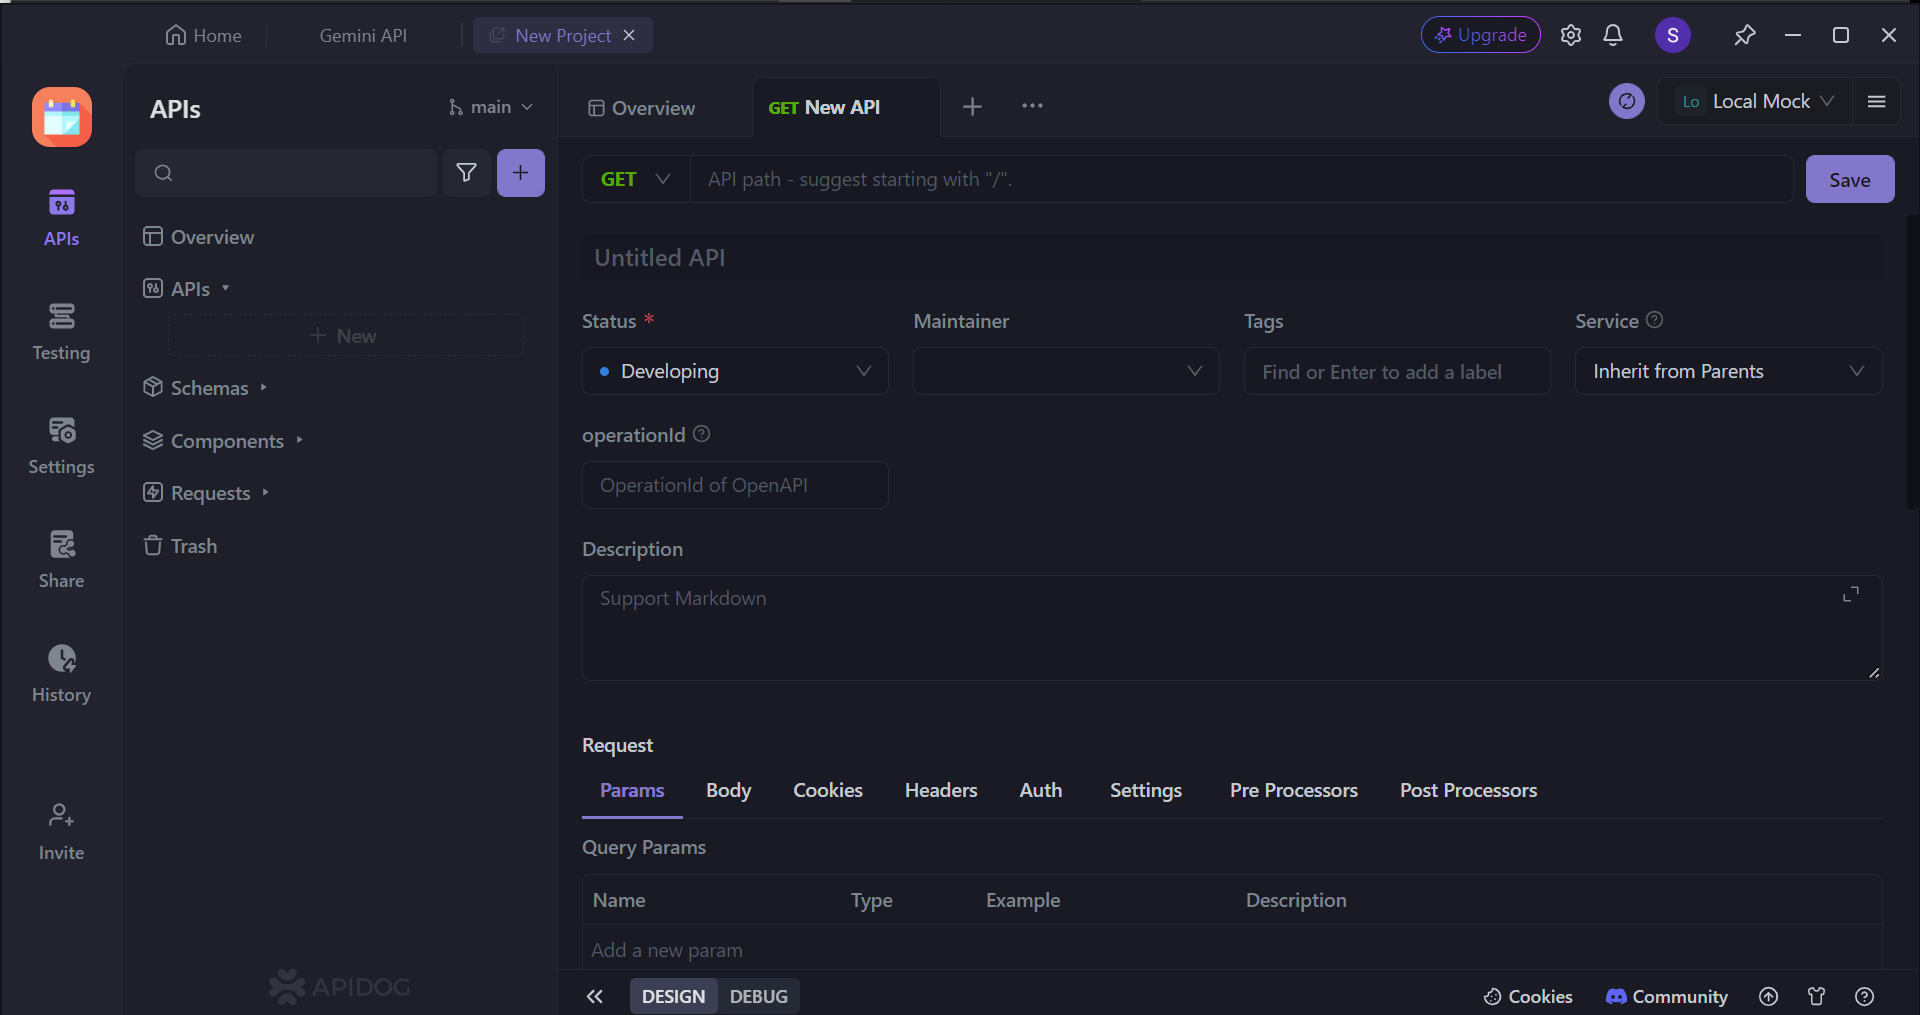
Next, you can select many of the API's characteristics. On this page, you can:
- Set the HTTP method (GET, POST, PUT, or DELETE)
- Set the API URL (or API endpoint) for client-server interaction
- Include one/multiple parameters to be passed in the API URL
- Provide a description of what functionality the API aims to provide.


View Complete Details About Your API's Requests and Responses with Apidog
Apidog has a couple of additional features on top of what Postman has to cater to users' needs when troubleshooting APIs are needed.
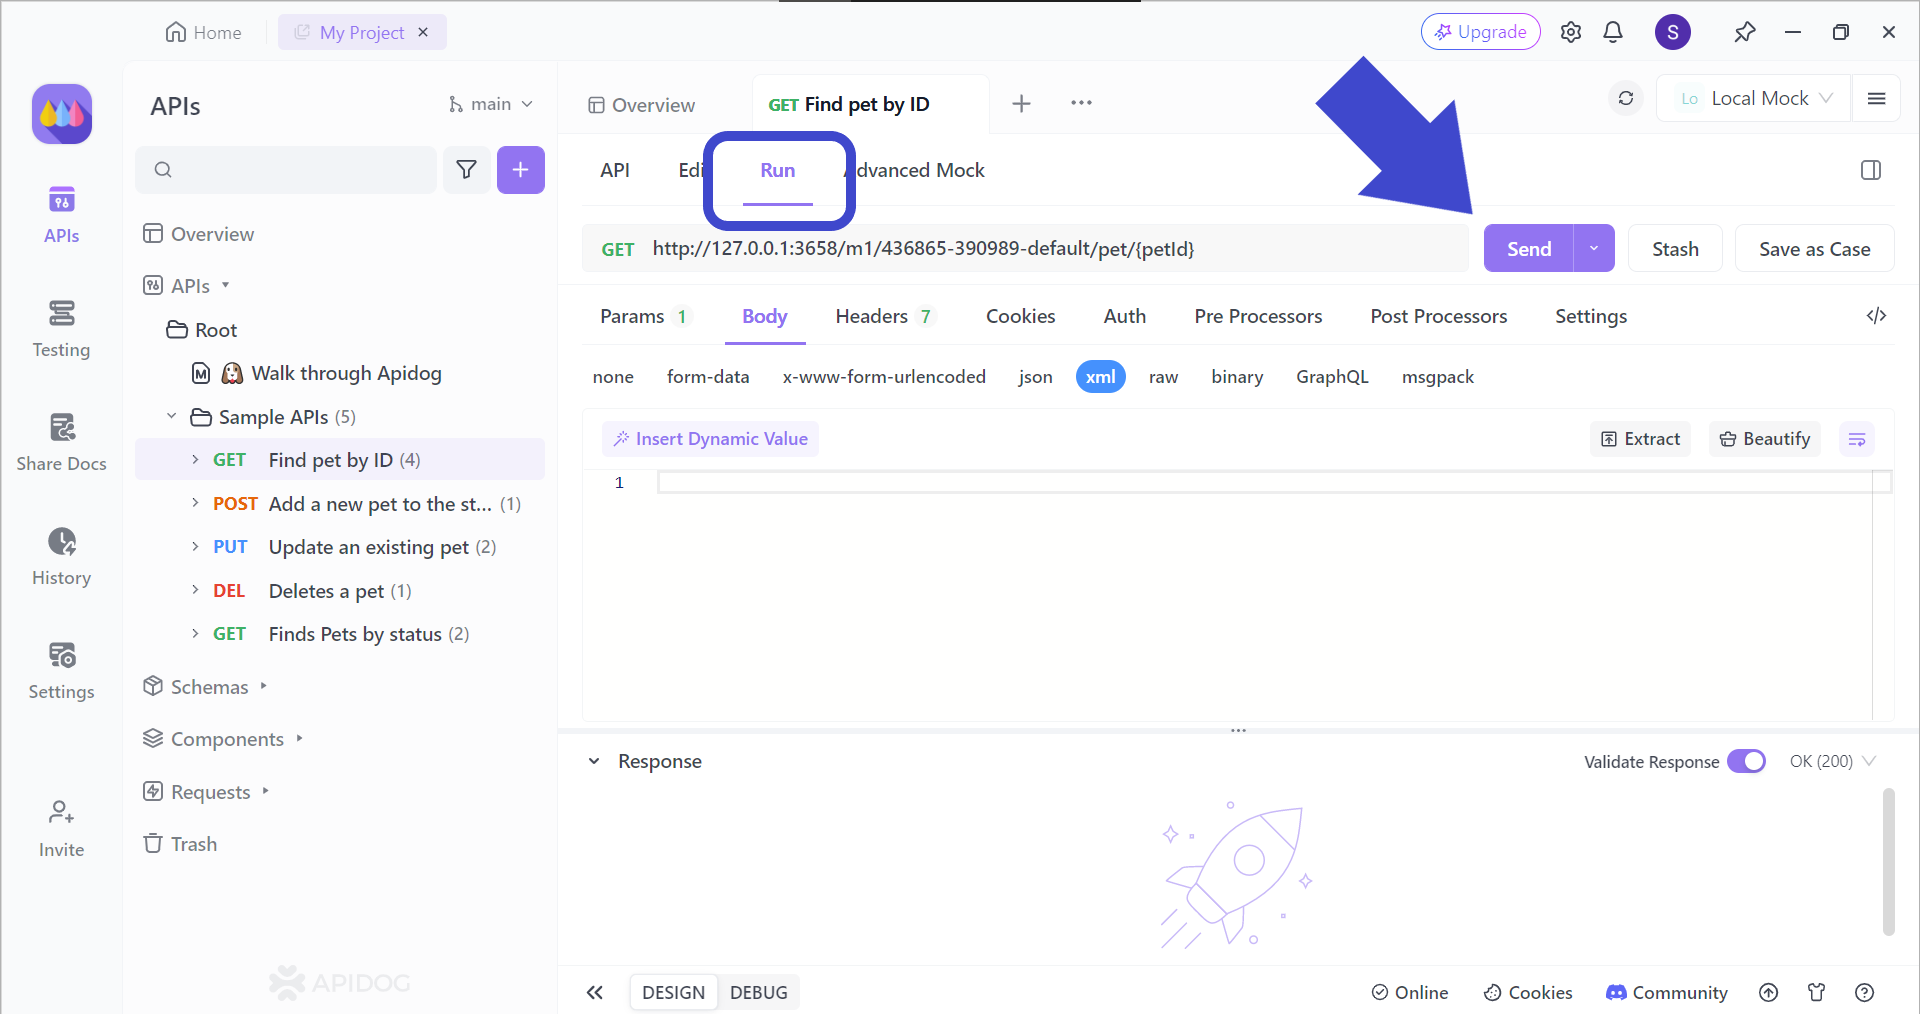
To observe your API closer, select an API you wish to troubleshoot and select the Run header. This should display the Send button, as shown in the image above.
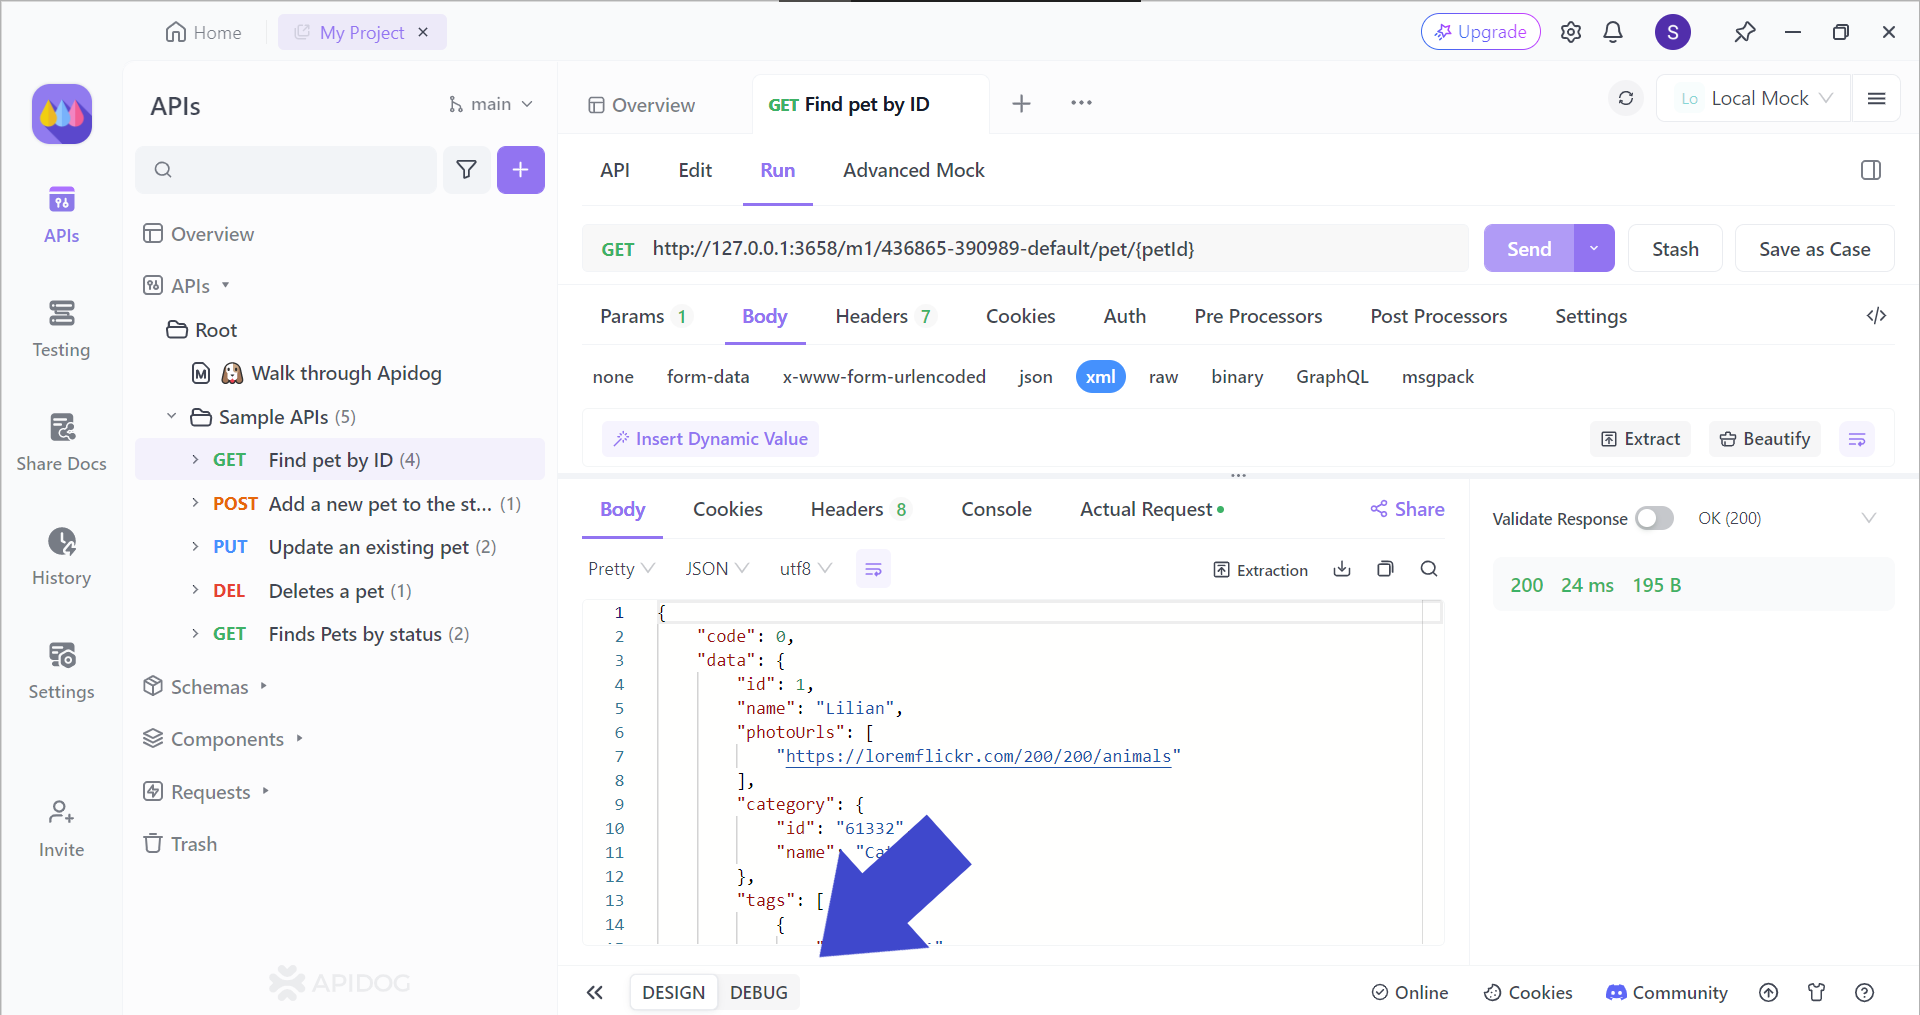
You should then receive an API response. To view more details regarding the response, press the DEBUG section, as pointed out by the arrow in the image above.
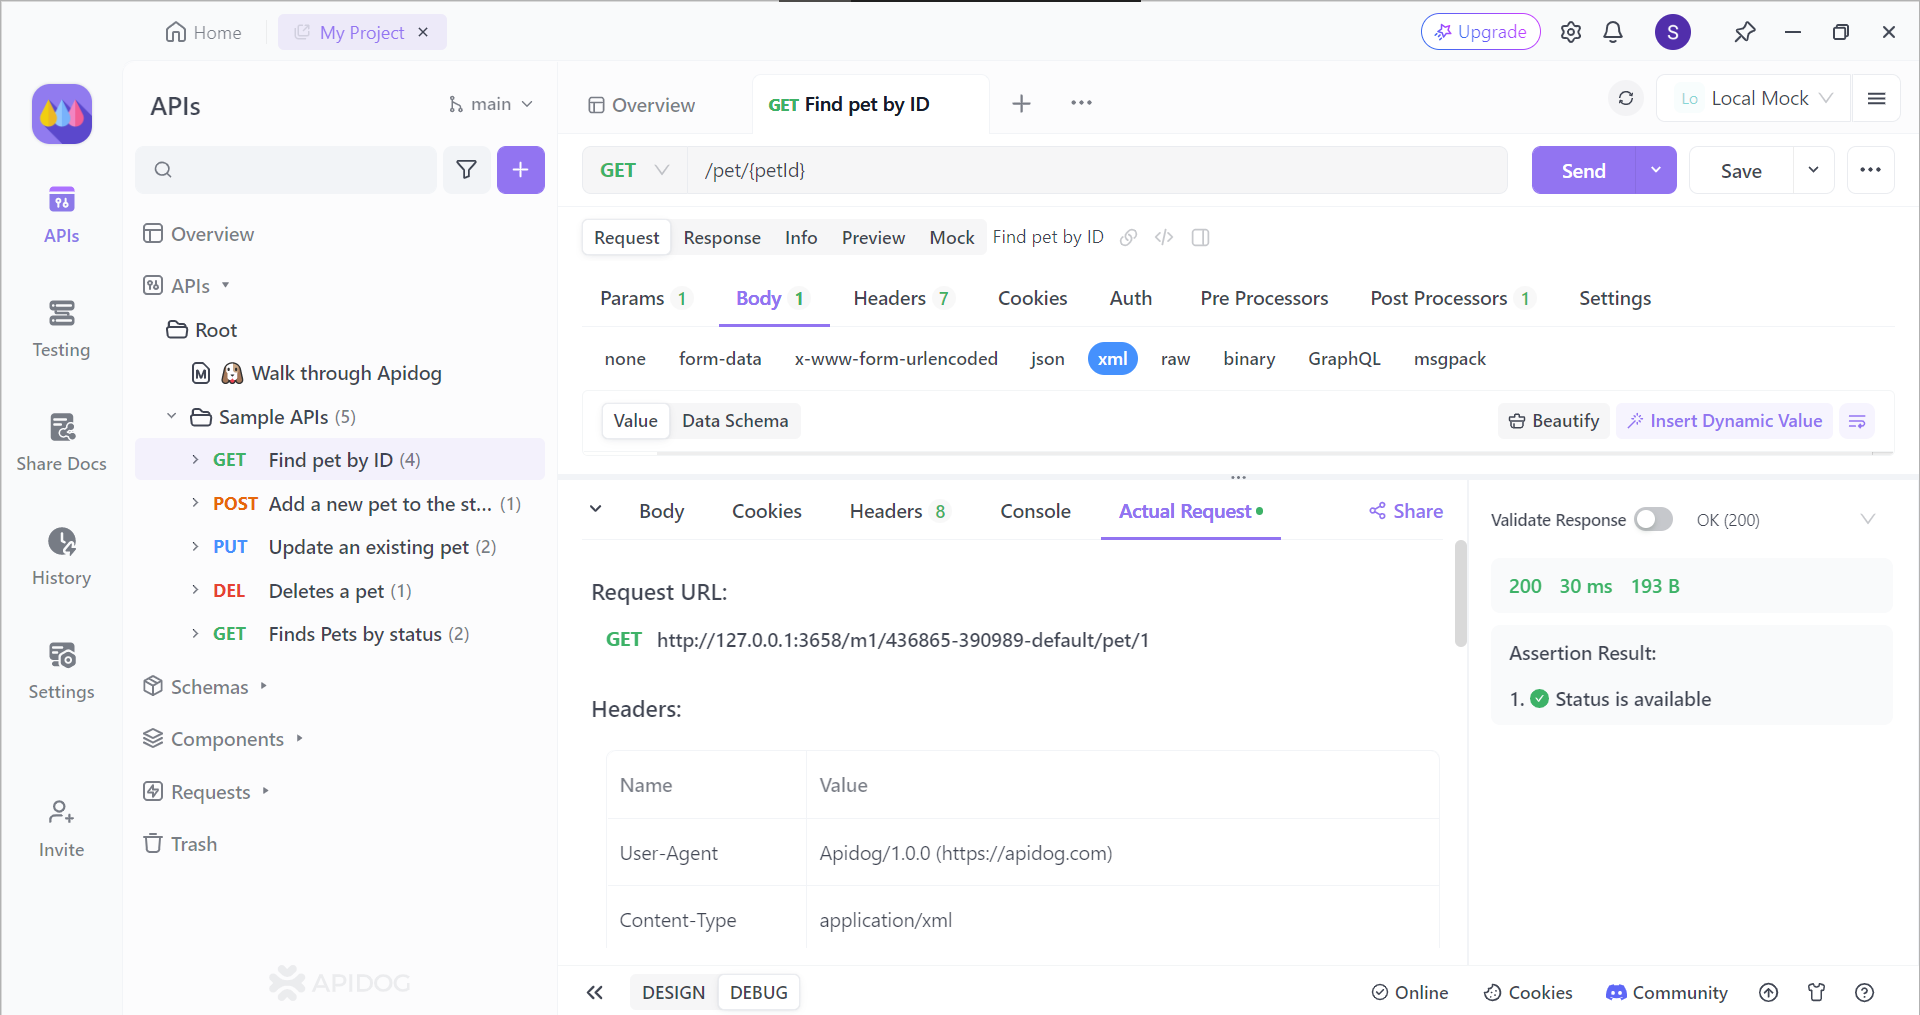
You can now see various new headers:
- Body
- Cookies
- Headers
- Console
- Actual Requests
All of these sections provide different details about your API's request and response, so take your time to see which part your API needs refinement on!
The console is especially useful for inspecting how Postman serializes request bodies, which becomes relevant when working with specific primitive types —controlling exactly how boolean values travel through your requests is a detail that catches teams off-guard more often than expected.
Conclusion
The Postman console serves as a powerful debugging tool within the Postman application. Through learning how to open the Postman console, you can utilize real-time insights into request and response details, script outputs, and potential errors, empowering you to streamline their API troubleshooting process.
Whether you're a seasoned API developer or just starting out, familiarizing yourself with the Open Console can significantly enhance your workflow and expedite the debugging of even the most complex API interactions. Remember, with the Open Console at your fingertips, you can transform API debugging from a frustrating experience to a smooth and efficient journey.


