Node.js provides powerful tools for measuring and optimizing the performance of your applications. One such tool is the Performance API, which allows developers to capture high-resolution timestamps and various performance metrics. This guide will introduce you to the key components of the Node.js Performance API and how to use them effectively.
Why Performance Matters in Node.js
Node.js shines in its event-driven, asynchronous architecture, perfectly suited for I/O-bound tasks. However, even in this non-blocking environment, performance remains paramount. Slow applications lead to frustrated users and hinder scalability. Identifying bottlenecks and optimizing code becomes essential for a seamless user experience.
Interested in increasing your API response time? The following article offers a step-by-step guide on how to increase your API response time.

Why Use the Node.js Performance API?
- Identify Performance Bottlenecks: Performance bottlenecks can significantly degrade the user experience. Using the Performance API, developers can pinpoint exact moments where delays occur, whether in function execution, resource loading, or HTTP request handling. This precision enables targeted optimizations.
- Optimize Resource Usage: Monitoring performance helps in understanding how resources like CPU and memory are being utilized. By identifying inefficient resource usage, developers can optimize their code to be more efficient, reducing costs and improving scalability.
- Enhance User Experience: Applications that respond quickly provide a better user experience. The Performance API helps in measuring key metrics such as Time to First Byte (TTFB) and First Contentful Paint (FCP), allowing developers to make improvements that lead to faster load times and smoother interactions.
- Improve Application Stability: Continuous performance monitoring helps in detecting anomalies and potential issues before they become critical. This proactive approach ensures higher uptime and reliability of the application.
Intro to the Node.js Performance API
The Performance API, accessible through the perf_hooks module, equips Node.js developers with a comprehensive toolkit for measuring and analyzing application performance. It offers a significant advantage over traditional methods like Date.now(), providing high-resolution timing and a more structured approach to performance evaluation. In the Date.now() method, you'll see something like;
const startTime = Date.now();
// call a function to perform a task()
console.log(`Task duration: ${Date.now() - startTime} milliseconds`);
The Date.now() function works well, but again while seemingly straightforward, this method can be unreliable because system clock changes can throw off the measurements.
This is where the Node.js Performance API comes into the scene. We want to be able to fully measure our application time usage and be bothered with things like system clock, right?
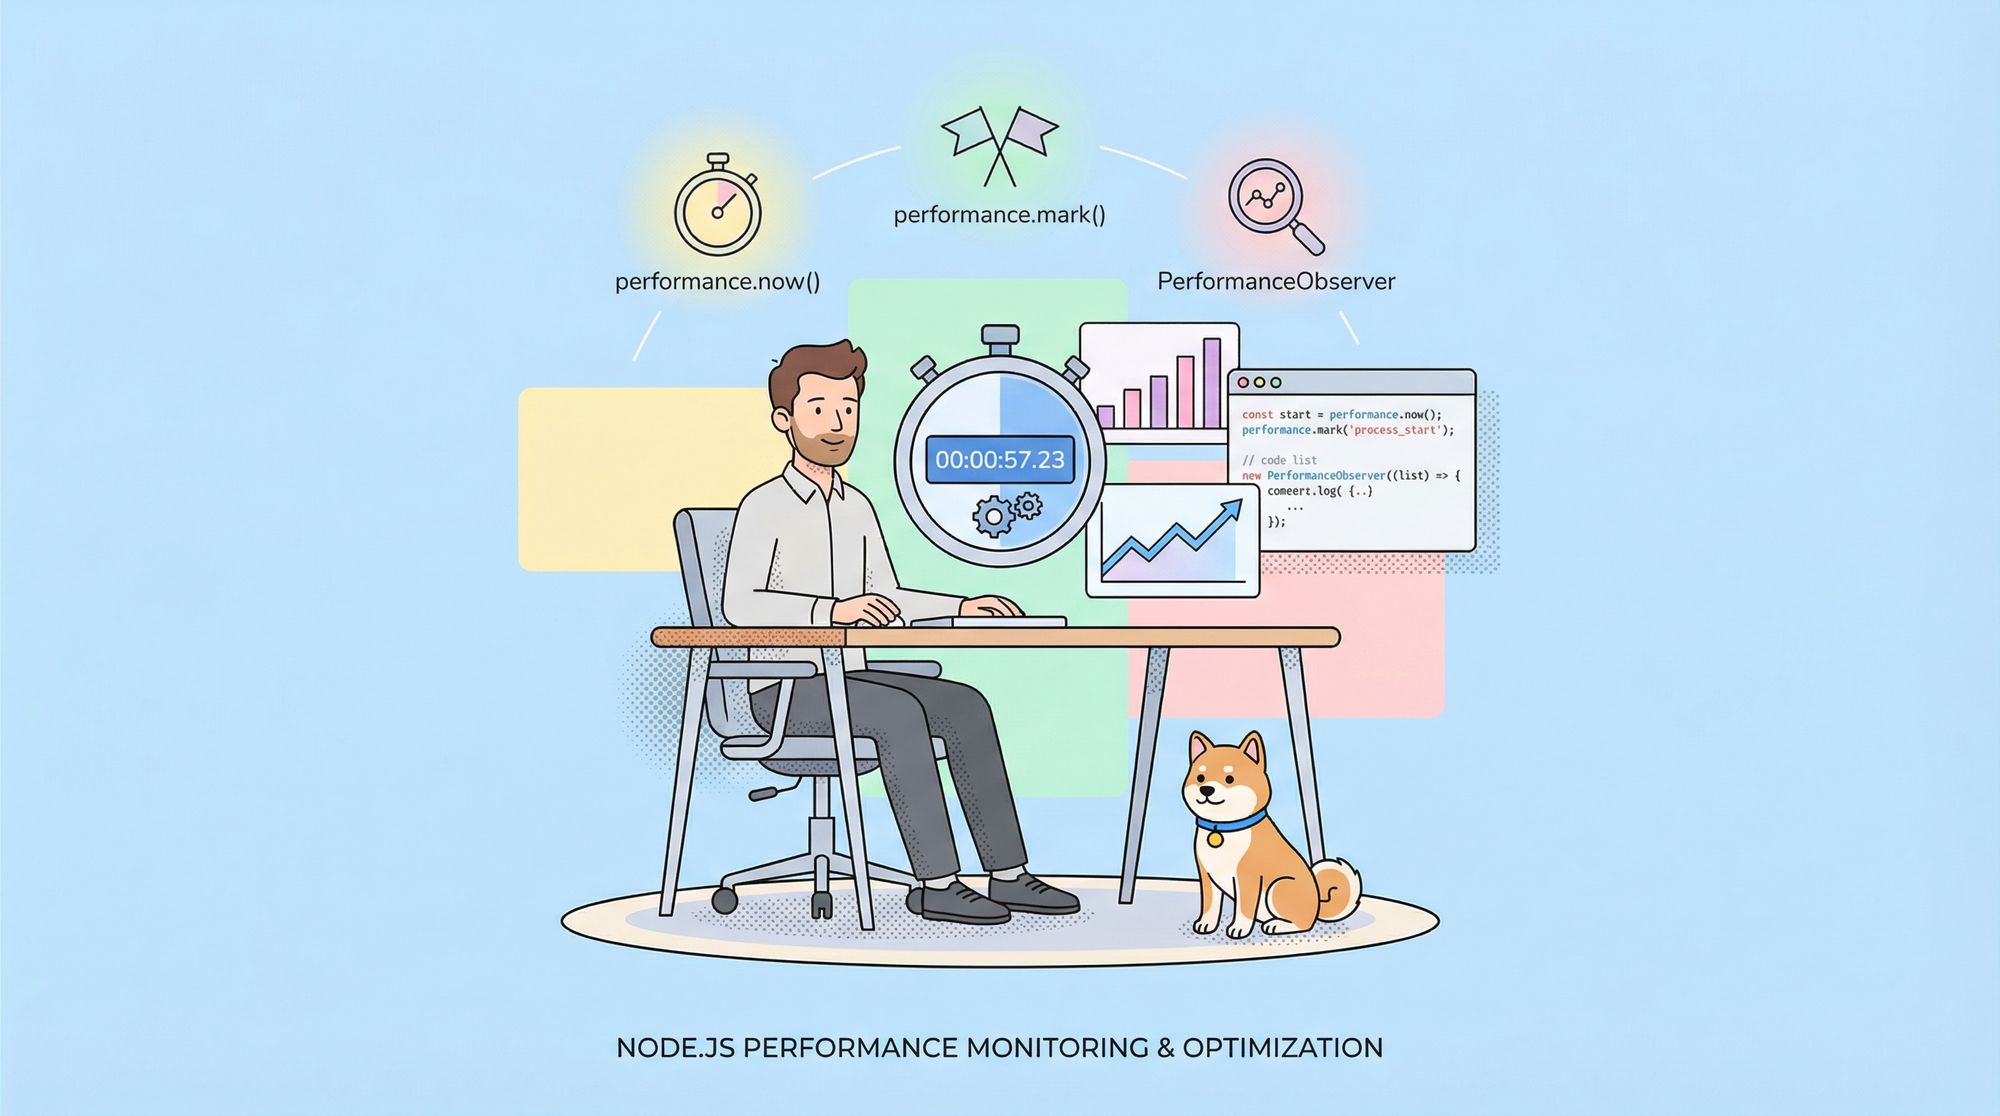
The Node.js Performance API is built around several core methods and classes provided by the perf_hooks module. These include:
Each of these tools serves a distinct purpose in capturing and analyzing performance metrics.
Using performance.now()
The performance.now() method returns a high-resolution timestamp in milliseconds. This is useful for measuring intervals within your application with greater precision than Date.now().
To get the duration of a task, add the performance.now() method at the start and end of the operation you want to measure as follows;
const { performance } = require('node:perf_hooks');
const start = performance.now();
// Perform some operations
const end = performance.now();
console.log(`Time taken: ${end - start} ms`);
First of all, we import the performance from the node modules, and then we create start and end constants and assign the performance.now methods to them to get the accurate time of the operation.
The output of the above code should look like the following;
Time taken: 1253.**** ms.Using performance.mark()
The performance.mark() method in Node.js allows you to create named timestamps (or marks) at specific points in your code. These marks help you measure the time taken between different parts of your application, giving you insights into performance bottlenecks.
const { performance } = require('node:perf_hooks');

performance.mark('A');
// Some operations
performance.mark('B');
In this example, performance.mark('A') and performance.mark('B') creates two marks labeled 'A' and 'B', respectively.
Marks can also include additional details, which can be useful for debugging or further analysis.performance.mark('A', { detail: 'Start of operation' }); performance.mark('B', { detail: 'End of operation' });
Here, the detail property provides extra information about what each mark represents.
Once you have created marks, you can measure the duration between them using performance.measure().
Using performance.measure()
performance.measure() is a function within the Performance API of Node.js that specifically calculates the duration between two marked points in your application's execution timeline. It essentially creates a measurement entry and stores the elapsed time for later retrieval and analysis.
Remember that in the performance.mark() section, we created two marks: A & B. In this section, we'll test them out and see how the performance.mark() works with performance.measure().
performance.measure('A to B', 'A', 'B');
const measures = performance.getEntriesByType('measure');
measures.forEach(measure => {
  console.log(`${measure.name}: ${measure.duration}ms`);
});
This will create a measure named 'A to B', which calculates the time elapsed between marks 'A' and 'B'.
When you run the above code, the output will display the duration between the two marks 'A' and 'B'. Here is an example of what the console might print something like:
A to B: 12.345ms
This output indicates that the operations between marks 'A' and 'B' took approximately 12.345 milliseconds to complete.
Using PerformanceObserver
The PerformanceObserver interface in Node.js allows developers to asynchronously observe and handle performance entries such as marks, measures, and resource timing entries. It is particularly useful for monitoring and reacting to performance data as it is collected, making it an essential tool for real-time performance analysis and optimization.
To use PerformanceObserver, you need to create an instance of it and define a callback function that will handle the performance entries. Here’s a basic setup:
const { PerformanceObserver, performance } = require('node:perf_hooks');

const observer = new PerformanceObserver((list) => {
  list.getEntries().forEach((entry) => {
    console.log(entry);
  });
});

observer.observe({ entryTypes: ['mark', 'measure'] });
In this example:
- Importing
PerformanceObserverandperformance: ThePerformanceObserverandperformanceobjects are imported from theperf_hooksmodule. - Creating an Observer: An instance of
PerformanceObserveris created with a callback function. This function is called whenever new performance entries are recorded. - Observing Entry Types: The
observer.observemethod is called with an object specifying the types of entries to observe (markandmeasurein this case).
Practical Use Cases for PerformanceObserver
1. Real-Time Performance Monitoring:
PerformanceObserverallows you to continuously monitor application performance, providing immediate feedback on performance issues. This is particularly useful in production environments where real-time performance data is critical.
2. Analyzing Resource Loading:
- By observing resource timing entries, developers can analyze how various resources (like scripts, stylesheets, and images) are loaded, helping to optimize load times.
3. Debugging and Profiling:
- During development,
PerformanceObservercan be used to profile specific parts of the code, identifying slow functions and potential bottlenecks.
4. Custom Performance Metrics:
- Developers can create custom performance metrics by marking and measuring important points in the application, allowing for more granular performance analysis tailored to the specific needs of the application.
Application Testing in Node.js
So far, we've learned about the Node.js Performance API, why it matters, how it works, and how it differs from the default Date.now() function.
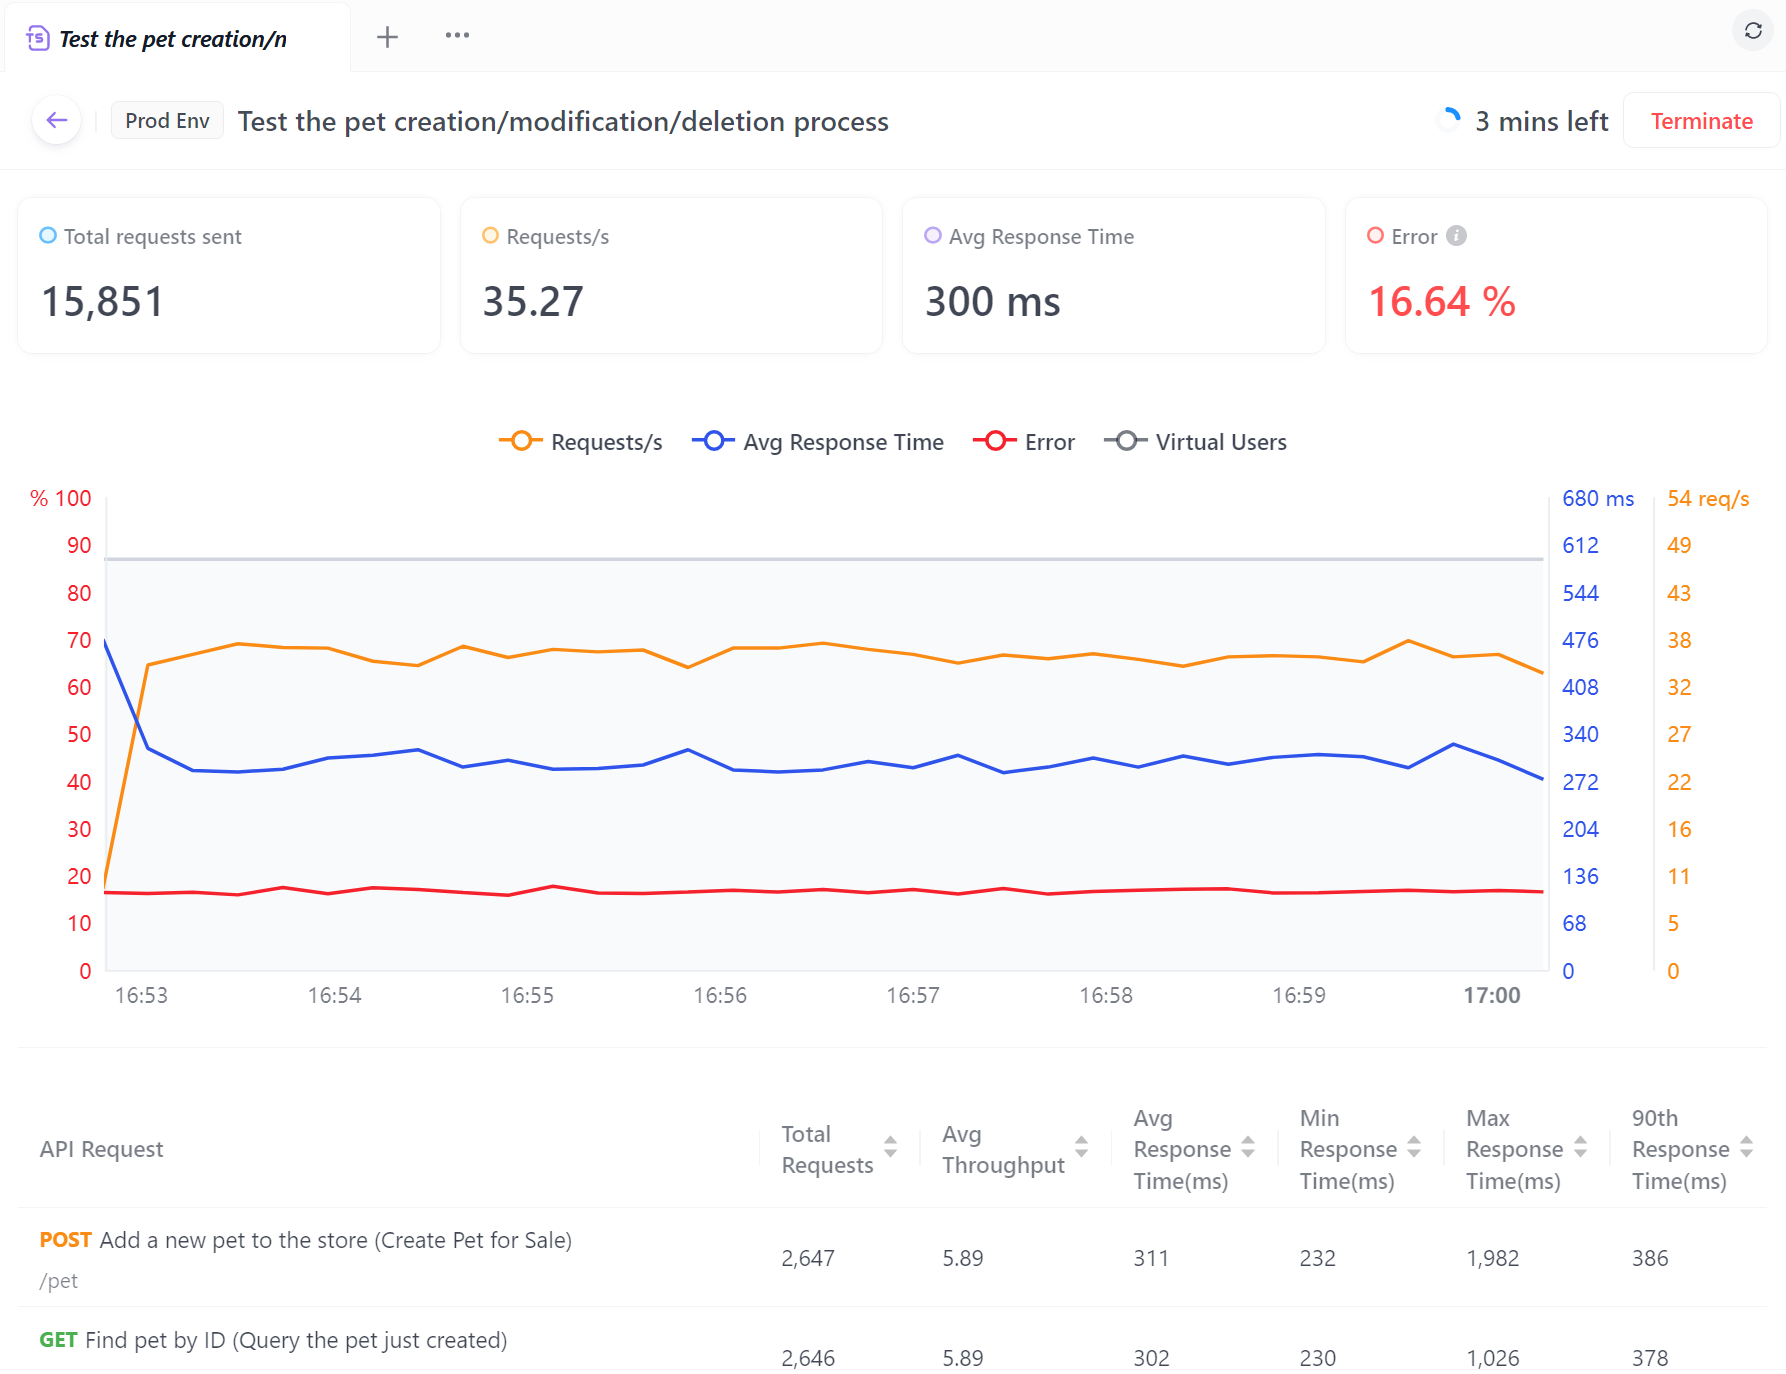
If you're building an application though, you'll want to focus on building your application and leave the testing to other services. Well, thanks to Apidog, you can test your APIs and applications.

Apidog is a powerful tool specifically designed for API testing, including performance testing. It offers comprehensive solutions for creating, managing, and testing APIs. Apidog allows you to simulate API behaviors, define test cases, and generate detailed reports. With its intuitive interface, you can easily configure performance tests, analyze response times, and identify performance bottlenecks.

Conclusion
The Node.js Performance API, including tools like performance.mark(), performance.measure(), and PerformanceObserver, provides developers with powerful capabilities for monitoring and optimizing application performance. By leveraging these tools, you can gain precise insights into the performance characteristics of your Node.js applications, identify bottlenecks, and implement targeted optimizations to enhance efficiency and user experience.
Beyond the Performance API, employing best APIs/Application practices, and robust load testing and monitoring can significantly boost the overall performance of your applications. These combined efforts ensure that your Node.js applications run smoothly, scale effectively, and provide a superior user experience, thereby maintaining a competitive edge in the market.


