Are you looking to master API testing using JMeter? In this comprehensive tutorial, we will provide you with a step-by-step guide to using JMeter for API testing. Whether you are a beginner or an experienced tester, this tutorial will cover everything you need to know to effectively use JMeter for API testing.
What is JMeter?
JMeter is an open-source performance testing tool that is widely used for testing the performance and load of web applications. It allows users to simulate various scenarios and measure the performance of the target application under different loads and conditions.
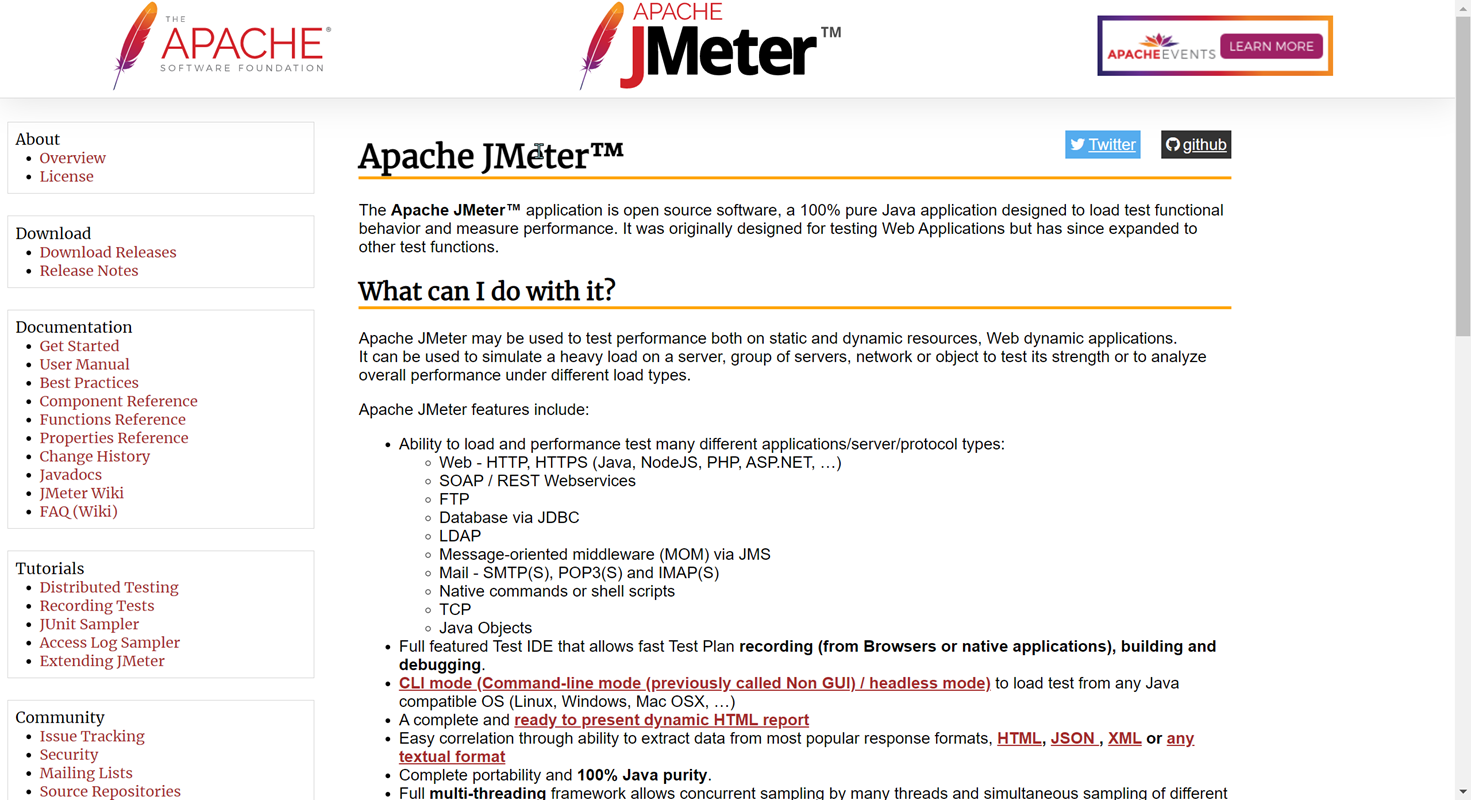
JMeter supports a wide range of protocols such as HTTP, SOAP, HTTPS, FTP, JDBC, and more, making it suitable for testing different types of applications. With JMeter, users can create test plans, define test scenarios, and generate detailed reports to analyze the performance of their applications. It is a versatile and powerful tool that helps developers and testers ensure the reliability, scalability, and efficiency of their web applications.
Why JMeter for API Testing?
JMeter is an excellent choice for API testing due to its versatility, robustness, and open-source nature. It allows reusable test scripts for automated and consistent API testing, simulating numerous virtual users for performance and load testing. JMeter offers cross-platform compatibility, detailed reporting, plugin extensibility, stress testing capabilities, and a streamlined API testing process.
With its flexibility, reliability, and depth, JMeter is a powerful tool for automating thorough API tests and gaining valuable insights into API performance under diverse conditions.
JMeter for API Testing Preparasite
To download and configure the JMeter environment, follow these steps:
Download JMeter:
- Go to the official JMeter website, choose the appropriate version of JMeter for your operating system (e.g., Windows, Linux, macOS) and click on the download link.
- Once the download is complete, extract the downloaded file to a directory of your choice. This will create the JMeter installation directory. Before running JMeter, make sure you have Java Development Kit (JDK) installed on your system. JMeter requires JDK to run.
Configure :
- Configure the environment variables for Java. This step may vary depending on your operating system.
For Windows: Set the JAVA_HOME environment variable to the directory where JDK is installed (e.g., C:\Program Files\Java\jdk1.x.x_xx).
For Linux/macOS: Set the JAVA_HOME environment variable in your shell profile (e.g., ~/.bashrc or ~/.bash_profile).
2. Open a command prompt or terminal and navigate to the JMeter bin directory. Run the JMeter executable file:
For Windows: Run jmeter.bat.
For Linux/macOS: Run ./jmeter.sh.
- JMeter will start, and you can begin using it to create and execute performance tests.
JMeter Load Testing: Long & Short Connection
JMeter is used for single API performance testing, specifically for load testing a particular interface. For scenario-based performance testing, LoadRunner (LR) is used. In JMeter, when adding an HTTP request, selecting "keepalive" indicates a long connection, while leaving it unchecked indicates a short connection.
- The concept of long connections and short connections applies to TCP connections. A TCP connection is a two-way channel that can remain open for a period of time.
- A long connection refers to maintaining the connection after the link establishment and keeping it active during idle periods. It is less secure. A short connection, on the other hand, is terminated after each communication and a new connection is established for the next communication.
- Long connections are commonly used in scenarios that require continuous communication, such as message push and link reuse. Short connections are commonly used in HTTP technology, where a connection may be kept open for a period of time.
- The implementation of a long connection involves the client program sending a keep-alive packet to the server program at regular intervals. If the keep-alive packet is not sent for a long time, the server program will disconnect the connection.
- HTTP 1.1 defaults to keeping connections alive, while HTTP 1.0 uses short connections.
- Long connections are commonly used in database connections. Frequent use of short connections can lead to socket errors, and frequent creation of sockets also wastes resources.
These components collectively enable efficient and comprehensive testing in JMeter.
How to Automate API Testing Using JMeter?
- Create a Test Plan: In the JMeter interface, right-click on the Test Plan element in the Test Plan tree and select "Add" -> "Threads (Users)" -> "Thread Group". This will create a Thread Group element, which represents a group of users.
- Configure the Thread Group: Set the desired number of threads (virtual users) and the ramp-up period (time to start all threads) in the Thread Group element. You can also specify the loop count and duration of the test.
- Add an HTTP Request Sampler: Right-click on the Thread Group, select "Add" -> "Sampler" -> "HTTP Request". This will add an HTTP Request Sampler to the Thread Group.
- Configure the HTTP Request Sampler: Provide the necessary details such as the server name or IP address, port, protocol, path, and method (GET, POST, etc.) in the HTTP Request Sampler. You can also add parameters, headers, and body data as required.
- Add Listeners: Listeners are used to view and analyze the test results. Right-click on the Thread Group, select "Add" -> "Listener" and choose the desired listener, such as "View Results Tree" or "Summary Report".
- Run the Test: Click on the "Play" button in the JMeter toolbar to start the test execution. JMeter will send requests to the specified API endpoints based on the configured settings.
- Analyze the Results: Once the test execution is complete, analyze the results using the chosen listeners. You can view response times, error rates, and other metrics to evaluate the performance and functionality of the API.
- Customize and Enhance the Test: JMeter provides various options to customize and enhance your API tests. You can add assertions to validate response data, use timers to introduce delays between requests, and incorporate logic controllers to create complex test scenarios.
By following these steps, you can effectively use JMeter to perform API testing and evaluate the performance and functionality of your APIs.
Apache JMeter Alternative for API testing: Apidog
Apidog is a more intelligent API design, development, testing tool. Compared to JMeter software, Apidog has the following advantages:
- Easy to Use: Apidog provides a simple and user-friendly interface, eliminating the need for scripting or complex configurations to perform API testing. It also offers free templates and examples to help users create API requests more quickly.
- Automated Testing: Apidog offers automated testing capabilities, allowing users to reduce testing time and manpower. Users can set up test plans, and Apidog will automatically run the tests, generate test results, and reports. Additionally, Apidog supports test suites, enabling the execution of multiple test cases at once to enhance testing efficiency.
- Multiple Environment Support: Apidog supports multiple testing environments, allowing users to test different APIs by switching environments. Users can set environment variables, and Apidog will automatically switch the URL and parameters for API requests. Moreover, Apidog supports environment import and export, making it easy for users to share testing environments among different devices or teams.
- Collaboration and Sharing: Apidog facilitates collaboration and sharing among team members or others by enabling the sharing of test results and data. Users can export test results and reports in HTML format. Additionally, Apidog supports team collaboration and permission management, allowing team members to share API design and testing resources.
In summary, Apidog is more user-friendly and intelligent compared to JMeter, helping users conduct API testing and management more efficiently. Whether you are an individual developer or a team within an organization, Apidog can enhance the efficiency and quality of API testing. Consequently, an increasing number of users are choosing to use Apidog instead of JMeter. Click here to register for free and start using Apidog.
Conclusion
By the end of this tutorial, you will have a solid understanding of performance testing concepts and be able to use JMeter effectively for performance testing your applications. So let's dive in and start mastering performance testing with JMeter!


