
Python debugging is a crucial skill for any developer. It allows you to identify and fix errors or bugs in your code, ensuring that your program runs smoothly and efficiently. Previously, we have discussed how to create and run a WebSocket Server in Python.
In this post, we will introduce you to the world of Python debugging and provide you with some valuable tips and techniques to help you become a proficient debugger.
Setting up a Debugging Environment in Python
In order to effectively debug your Python code, it is important to set up a proper debugging environment. In this section, we will explore some essential tools and techniques that can help you debug your code efficiently.
- Integrated Development Environments (IDEs): One of the most popular ways to set up a debugging environment in Python is by using an Integrated Development Environment (IDE). IDEs provide a comprehensive set of tools for writing, running, and debugging code. Some popular Python IDEs include PyCharm, Visual Studio Code, and Spyder. These IDEs offer features like breakpoints, variable inspection, step-by-step execution, and more, making the debugging process much easier.
- Debuggers: Debuggers are powerful tools that allow you to pause the execution of your code at specific points, known as breakpoints, and inspect the values of variables and expressions. Python provides a built-in debugger called
pdb(Python Debugger), which can be invoked from the command line or integrated into your code. Thepdbmodule offers various commands for stepping through code, examining variables, and evaluating expressions. - Logging: Logging is another useful technique for debugging in Python. By strategically placing log statements in your code, you can track the flow of execution and identify potential issues. Python's built-in
loggingmodule provides a flexible and customizable logging framework that allows you to log messages at different levels of severity. You can configure the logger to write log messages to a file, the console, or any other desired destination. - Debugging APIs with Apidog: When working with APIs, debugging can become a bit more challenging. However, with the help of tools like Apidog, debugging APIs becomes much easier.
Apidog is an API debugging tool that provides a user-friendly interface for testing and debugging APIs. It allows you to send requests, inspect responses, and view detailed information about the API calls. Additionally, Apidog supports a debug mode, which can be enabled to capture detailed logs and debug information during API interactions.
Apidog's "Debug Mode" is a feature designed to provide a convenient API debugging and documentation generation tool for backend development teams following the "code-first" development approach. In this mode, users can directly debug API without the need to define API documentation in advance, similar to how Postman operates.
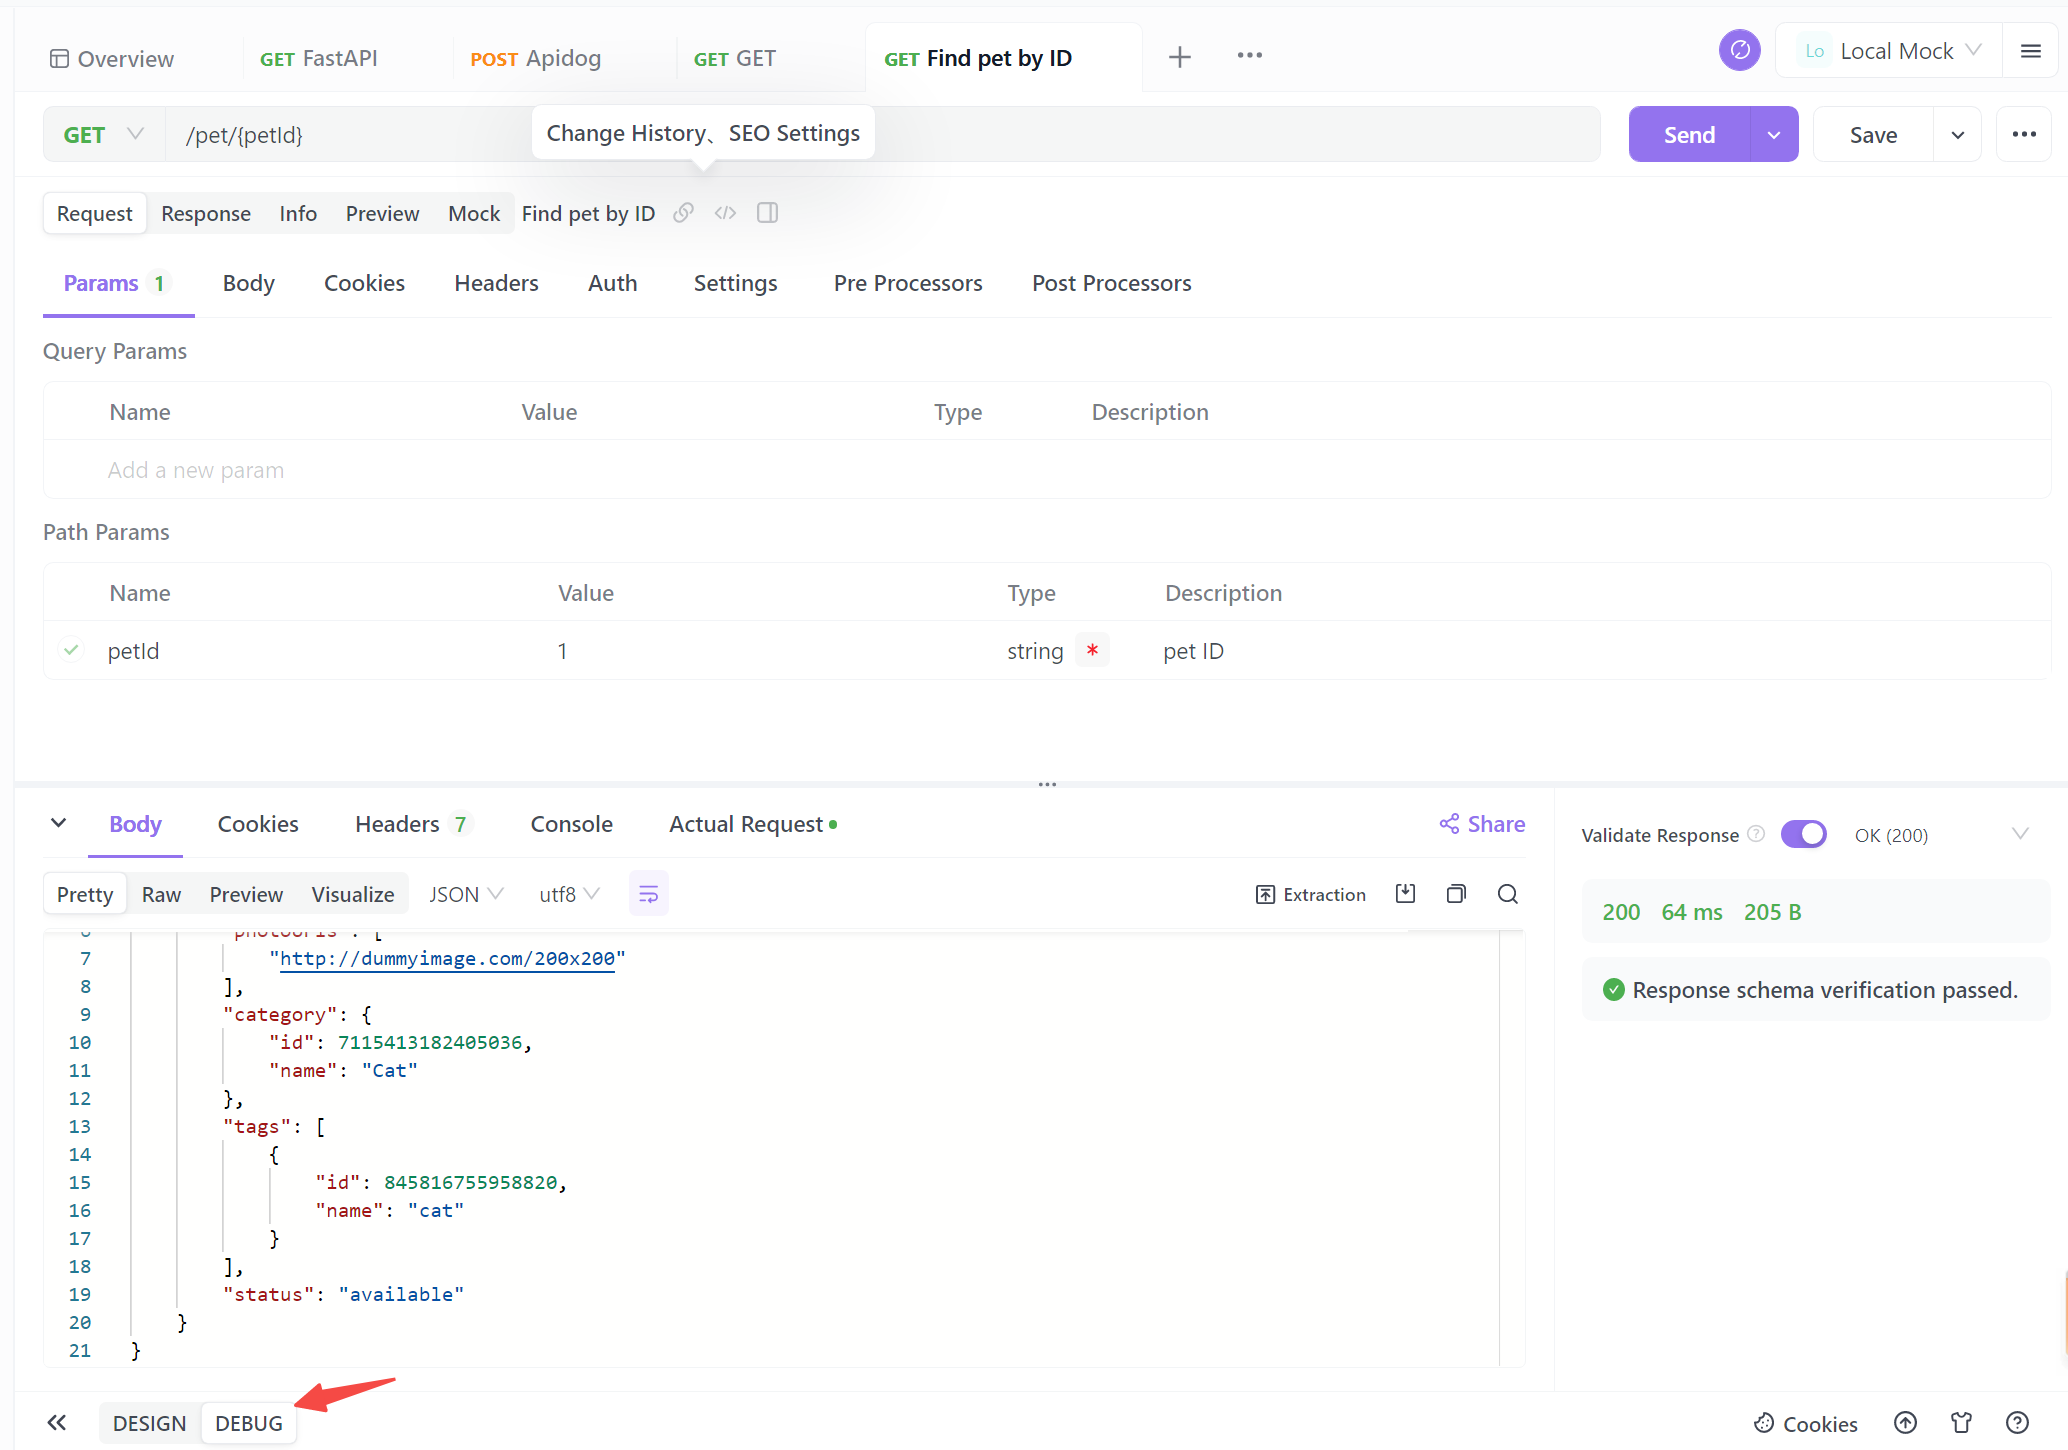
Once an API is successfully debugged, users can simply click "Save," and the system will automatically generate the corresponding API documentation. This greatly facilitates team collaboration, and compared to Postman, Apidog's Debug Mode is more robust and user-friendly.
In the next section, we will explore some basic debugging techniques that can help you identify and fix common issues in your Python code.
Basic Debugging Techniques in Python
One common method of debugging in Python is to use print statements. By strategically placing print statements throughout our code, we can output the values of variables or the execution flow to the console. This can help us understand how our code is functioning and identify any unexpected behavior. However, this method can be time-consuming and tedious, especially when dealing with complex programs.

To overcome the limitations of print statements, Python provides a built-in module called pdb, which stands for "Python Debugger". pdb allows us to pause the execution of our program at specific breakpoints and interactively explore the state of our program. We can step through the code line by line, inspect variables, and even modify their values on the fly. This powerful tool greatly simplifies the process of debugging and makes it more efficient.
Another useful technique for debugging in Python is using an Integrated Development Environment (IDE) that provides advanced debugging features. IDEs like PyCharm, Visual Studio Code, and Eclipse have built-in debuggers that allow us to set breakpoints, step through code, and analyze variables. These debuggers provide a more user-friendly and visual debugging experience, making it easier to identify and fix issues in our code.
Apart from traditional debugging techniques, there are also specialized tools available for debugging APIs. One such tool is Apidog, which provides support for debugging APIs. Apidog allows us to intercept API requests and responses, inspect the data being transmitted, and identify any issues or errors. It provides a user-friendly interface where we can view the details of API calls, including request headers, response status codes, and response payloads. With Apidog, we can effectively debug and troubleshoot API-related problems, ensuring the smooth functioning of our applications.
Advanced debugging techniques in Python
In the previous sections, we discussed the basics of debugging in Python and how to set up a debugging environment. Now, let's dive into some advanced debugging techniques that can help you troubleshoot complex issues in your Python code.
1. Logging
Logging is a powerful technique that allows you to track the execution of your code and identify any errors or unexpected behavior. Python provides a built-in logging module that you can use to log messages at different levels of severity. By using logging statements strategically throughout your code, you can gather valuable information about the flow of execution and the values of variables.
Here's an example of how you can use the logging module:
import logging

# Set the logging level
logging.basicConfig(level=logging.DEBUG)

# Log messages at different levels
logging.debug('This is a debug message')
logging.info('This is an info message')
logging.warning('This is a warning message')
logging.error('This is an error message')
logging.critical('This is a critical message')
By default, the logging messages are written to the console. However, you can configure the logging module to write the messages to a file or even send them to a remote server for analysis.
2. Remote Debugging
Sometimes, the issue you're trying to debug might occur only in a production environment or on a remote server. In such cases, it can be challenging to reproduce the problem locally and debug it. That's where remote debugging comes in handy.
Python provides a library called pdb (Python Debugger) that allows you to remotely debug your code. With pdb, you can set breakpoints, step through the code, and inspect variables, just like you would do with a local debugger.
Another powerful tool for remote debugging is Apidog. Apidog is an API documentation tool that also supports a debug mode. With Apidog's debug mode, you can intercept and inspect API requests and responses, making it easier to identify and fix issues with your APIs.
3. Profiling
Profiling is the process of measuring the performance of your code and identifying any bottlenecks or areas for optimization. Python provides a built-in module called cProfile that allows you to profile your code and generate detailed reports.
Here's an example of how you can use cProfile to profile your code:
import cProfile

def my_function():
    # Your code here# Profile the code
cProfile.run('my_function()')
The output of cProfile includes information such as the number of times each function was called, the total time spent in each function, and the time spent in each line of code. This information can help you identify performance bottlenecks and optimize your code accordingly.
In conclusion, these advanced debugging techniques can greatly enhance your ability to troubleshoot and fix issues in your Python code. Whether it's using the logging module to track the flow of execution, leveraging remote debugging to troubleshoot issues in production environments, or profiling your code to identify performance bottlenecks, these techniques will make your debugging process more efficient and effective. Additionally, tools like Apidog's debug mode can provide valuable insights when debugging APIs.
Import failures are among the most common bugs you'll trace, and resolving the "No module named yaml" error makes a good worked example of debugging Python's module resolution.
Conclusion
In conclusion, debugging is an essential skill for any Python developer. By following these tips and best practices, you can effectively debug your code and identify and fix issues quickly. Additionally, using tools like Apidog's debug mode can further simplify the debugging process, especially when working with APIs.


