A user reports that the agent “did something weird” yesterday afternoon. You open the logs and find this:
INFO  agent run started
INFO  calling tool: updateOrder
INFO  tool returned 200
INFO  agent run completed
The agent called updateOrder. You do not know with what arguments, against which order, why it chose that tool, or what came back. The run succeeded by every measure you recorded, and you cannot reconstruct a single decision it made.
Agent systems fail in ways that only make sense in hindsight, which means the log is the product. This guide covers what to record on every tool call, how to correlate a model decision with the HTTP request it produced, what to redact, and how to turn traces into tests. Our post on API observability covers the service side; this one covers the agent layer sitting on top of it.
Apidog is useful once you have a trace, because the fastest way to understand a bad call is to replay it against the same endpoint and watch what happens.
Three layers, one trace
An agent produces events at three levels, and most teams log only the middle one.
The reasoning layer is where the model decides. What was in context, which tools were offered, which one it picked, and with what arguments.
The tool layer is your executor. It validates arguments, applies policy, maps the call to an HTTP request, and handles the result.
The HTTP layer is the wire. Method, URL, headers, body, status, latency.
Debugging almost always crosses layers. “The agent sent the wrong customer ID” is a reasoning problem visible only at the HTTP layer. “The API returned a 200 with an empty body” is an HTTP problem that shows up as strange reasoning three steps later. If the three layers are not tied together by a shared identifier, you are stuck correlating by timestamp, which stops working the moment two runs overlap.
So the first rule: one trace ID per agent run, one span ID per tool call, and both stamped on every record at every layer. OpenTelemetry traces already model exactly this shape, and there is a growing set of GenAI semantic conventions for naming the attributes so your data is portable.
What to record on every tool call
A record that answers real questions has roughly this shape:
{
  "trace_id": "run_01J8ZK3M2Q",
  "span_id": "call_004",
  "parent_span_id": "call_003",
  "timestamp": "2026-08-26T14:03:11.482Z",
  "agent": "billing",
  "step": 4,

  "tool_name": "refundOrder",
  "tool_args": { "orderId": "ord_92", "amount": 1200, "reason": "duplicate" },
  "tools_available": ["getOrder", "listOrders", "refundOrder", "voidInvoice"],

  "http": {
    "method": "POST",
    "url": "/v1/orders/ord_92/refund",
    "request_body_hash": "sha256:1f4c...",
    "status": 200,
    "duration_ms": 412,
    "retry_count": 1,
    "idempotency_key": "9f2b7c14-6d3a-4b18"
  },

  "outcome": "success",
  "tokens": { "prompt": 8420, "completion": 96 },
  "policy": { "approval_required": true, "approved_by": "user_31", "dry_run": false }
}
Five fields do disproportionate work.
tool_args is the one most often missing, and it is the one you always want. Log the arguments the model produced, before your executor normalizes them. When an agent sends the wrong ID, this is where it is visible.
tools_available explains selection. If the model picked a strange tool, the first question is what else it had to choose from. This field costs a few bytes and answers it instantly.
retry_count separates “the API was slow” from “the API failed twice and then worked.” Without it, three attempts look like one call.
outcome should be an explicit enum, not something inferred from a status code. success, failed, timed_out, blocked_by_policy, rejected_by_human. The last two matter because a blocked call is a working guardrail, not an error, and mixing them corrupts your failure rate.
policy is your audit trail. When someone asks whether a destructive action was approved, this is the answer. It pairs with the enforcement described in our post on AI agent guardrails.
Log the decision, not only the action
The hardest agent bugs are choices, so record enough to reconstruct them.
Keep the tool definitions used for the run, or a hash of them. When selection accuracy shifts, the first suspect is a description someone edited, and a hash tells you immediately whether the tool set changed between a good run and a bad one. Our post on tool schema design covers why that text moves behavior so much.
Record the model and its settings. Model ID, temperature, and prompt version belong on the run record. Behavior changes across model versions, and without this field you will spend a day investigating your own code.
Record what the model saw, or at least its size. A full prompt dump is expensive to store and often sensitive. A token count plus a hash gives you most of the diagnostic value: a run whose prompt is twice the usual size is a run where something got appended that should not have been.
Record the raw tool result before trimming. If your executor projects responses down before handing them to the model, as in our post on keeping tool responses out of the context window, store the full payload in the trace. Otherwise you cannot tell whether the data was missing or you dropped it.
Redact before you store
Agent traces are unusually dangerous because they contain both the request and the reasoning around it, and prompts have a habit of collecting personal data.
Four rules keep this manageable.
Never store credentials. Strip Authorization, API keys, cookies, and any signed URL. Log the credential’s identifier, such as a key ID, and not the value. Our post on least-privilege API keys for agents covers why you want that identifier: it tells you which agent acted.
Redact at the boundary, not in the query. Filtering at read time means the secret was written to disk, replicated, and backed up. Redact in the logging middleware before the record leaves the process.
Hash bodies you cannot store. A request body hash still lets you prove two calls were identical, which is most of what you need for duplicate investigations, without keeping the payload.
Set retention by sensitivity. Full traces for a week, redacted summaries for a year. Most debugging happens within days; most audit questions arrive within months.
Turn traces into tests
The payoff for good tracing is not only faster debugging. It is a supply of realistic test cases.
Every failed run is a scenario. Take the tool calls from a bad trace, replay them against your API, and you have a reproduction. When the fix lands, keep the replay as a regression test. In Apidog you can rebuild the failing request as a saved case, assert the corrected behavior, and run it in CI, which is how a one-off incident turns into permanent coverage.
Traces also tell you what to mock. The endpoints your agent calls most, and the failure statuses it actually meets, come straight out of the data instead of guesswork. Build the mocks around those, following our post on running agents against mocks instead of production.
And they surface the slow drift you would otherwise miss. Track a few numbers per week: tool selection distribution, retry rate per endpoint, calls per completed task, and the percentage of runs blocked by policy. A shift in any of them is a signal before it becomes an incident. Contract-level checks, as in our API contract testing guide, catch the upstream change that usually caused it.
Three investigations the trace has to survive
“The agent charged the wrong customer.” You need the arguments the model produced, the resolved URL, and the step before it. Nine times out of ten the ID came from an earlier tool result that returned more than one match and the model picked the first. The trace shows the earlier result, the ambiguity, and the choice. Without tool_args you have a 200 and a very unhappy customer.
“It stopped working on Tuesday.” Compare a good run and a bad run field by field. Model ID, tool-set hash, prompt version, average response size. Something changed, and one of those four usually names it. This is why the run record carries configuration and not just events: a diff is only possible when both sides recorded the same fields.
“Did anyone approve this?” The policy block is the whole answer, and it has to be written at the moment of the decision, not reconstructed later. approval_required, approved_by, and a timestamp turn a tense conversation into a lookup.
Notice what these have in common. None of them are answered by “the tool returned 200.” All three are answered by fields that cost almost nothing to write and are impossible to recover after the fact.
Sampling, and what never to sample
Full-fidelity tracing on every run gets expensive at volume, so teams sample. Sample carefully, because agent traffic is not uniform.
Always keep every failed run, every run that hit a policy block, and every run containing a write. Those are the runs anyone will ask about. Sample the successful read-only runs, since they are the bulk of the volume and the least interesting individually, though you still want enough of them to compute your baselines.
Google’s SRE book chapter on monitoring is still the clearest statement of why you sample for signal rather than for volume, and the reasoning carries over directly.
Keep the run record even when you drop the payloads. A skeleton trace with tool names, outcomes, and durations is small and still supports the four metrics above. The expensive parts are bodies and prompts, and those are the parts you can drop first.
One warning about tail sampling: if you decide what to keep after a run finishes, make sure the decision happens after the outcome is known. A run that looks fine at step three and fails at step nine has to be retained in full, which means buffering rather than discarding as you go.
Where the trace should live
Everything above assumes you own the storage. That is the right assumption when the agent is your own service calling your own APIs. It is a poor fit when the agents are coding runtimes on developer machines, because the trace then lives in whichever terminal happened to run it.
Sharkly takes the other approach: the execution trace is attached to the Task the agent was assigned. Run history, the execution log, and the result sit next to the goal, the status, and the comment thread where a human reviewed the work. The practical difference is retrieval. “Why did the agent do that” becomes a question you answer by opening the task, rather than by finding the machine, the session, and the scrollback.
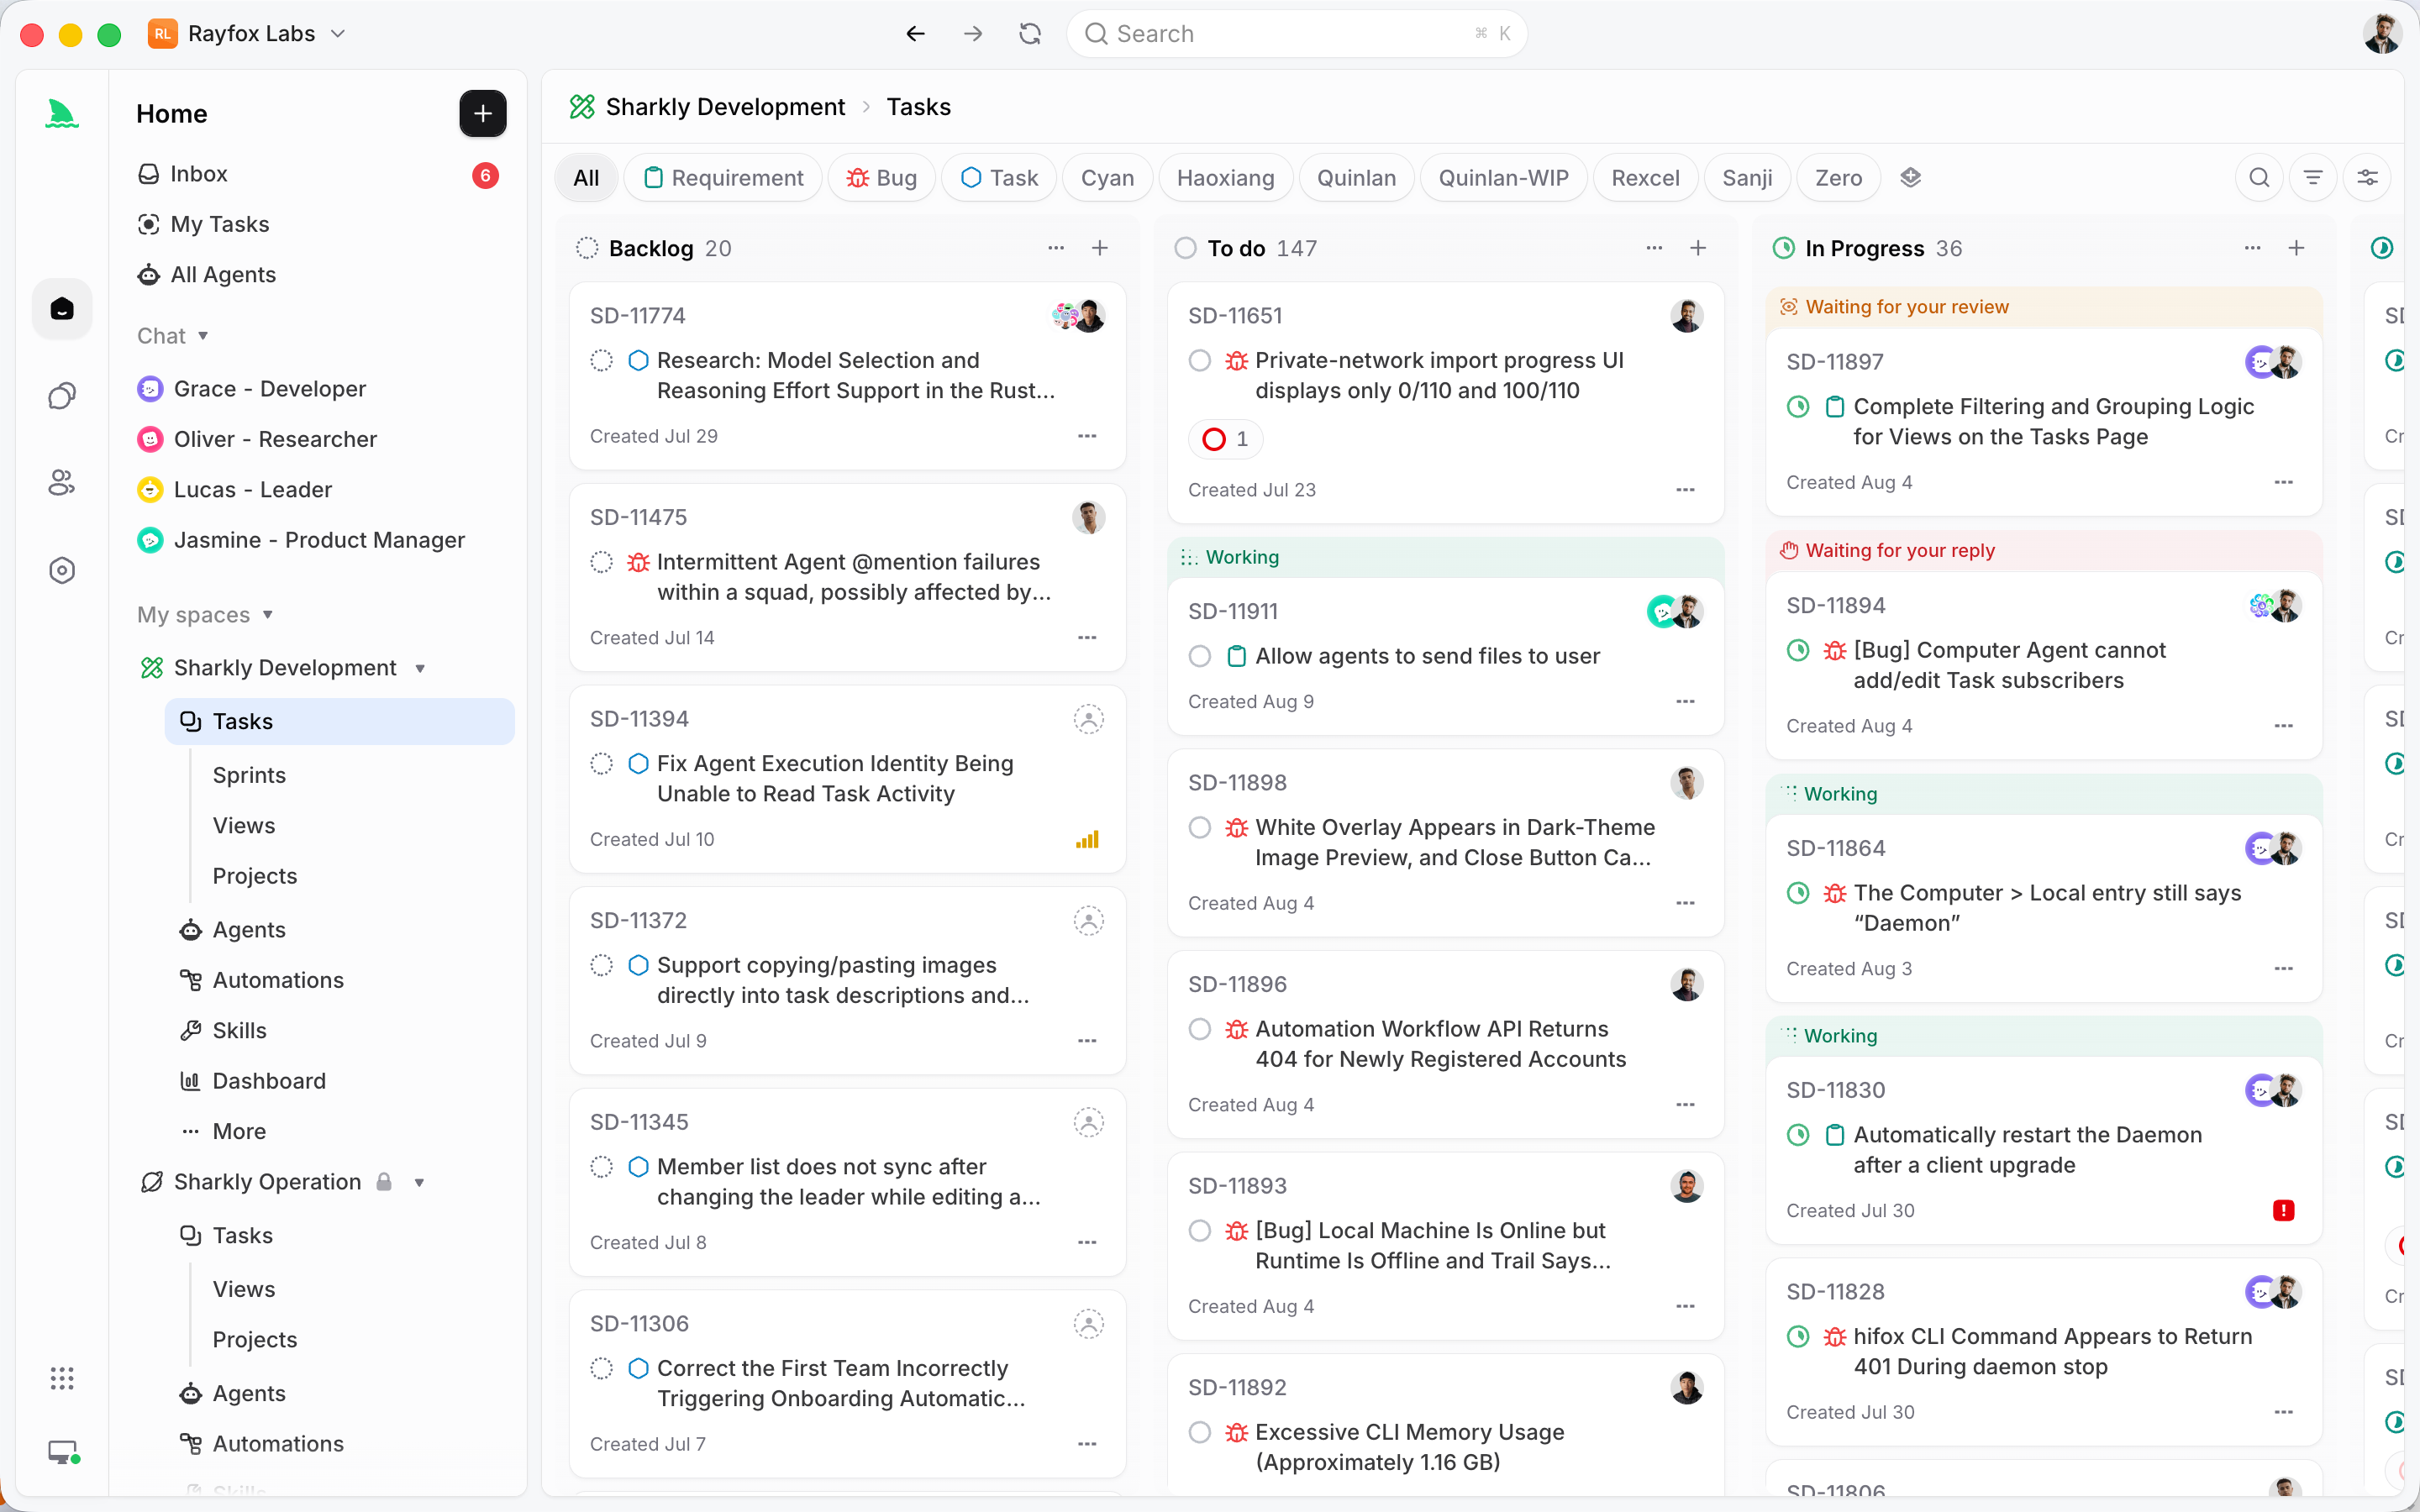
It does not replace the tracing described here, and it does not replace the runtime either; Claude Code and Codex still do the work. What it changes is where the record ends up when the agent is not a service you deployed.
Watch four numbers
Traces are only useful if someone looks. These four earn their place on a dashboard.
Calls per completed task. The clearest efficiency measure. If it climbs, the agent is exploring more, usually because a description got worse or an endpoint started failing.
Retry rate by endpoint. Ranks your least reliable dependencies and shows when one degrades. Our post on agent error recovery covers what to do about the top of that list.
Blocked-by-policy rate. Should be low and stable. A spike means either the agent is trying things it should not, or a policy is too tight and is now the bottleneck.
Time to first tool call. A slow start usually means a bloated prompt, and prompt size is the thing that grows without anyone deciding to grow it.
A checklist
- One trace ID per run, one span ID per tool call, stamped at all three layers.
- Model arguments logged before normalization.
- The available tool list recorded on every call.
- Outcome recorded as an explicit enum, including policy blocks.
- Retry count separate from call count.
- Model, temperature, prompt version, and tool-set hash on the run record.
- Raw tool results stored, not only the trimmed version handed to the model.
- Credentials stripped in middleware, bodies hashed where they cannot be stored.
- Retention tiered by sensitivity.
- Failed traces convertible into replayable test cases.
The goal is simple to state: when someone asks why the agent did that, you can answer from the record instead of from a guess. Download Apidog to replay the calls in a trace and keep the reproductions as tests.
Frequently asked questions
Should I use OpenTelemetry or a purpose-built agent observability tool? Use OpenTelemetry for the transport and the trace model, since it already handles correlation and your infrastructure probably speaks it. Agent-specific tools add useful views on top; the data underneath should still be portable.
How much does full tracing cost to store? Less than people expect, if you tier it. Full payloads for a few days and structured records without bodies for longer keeps most volume down. Prompt dumps are the expensive part, so hash and size them instead of storing them by default.
Do I need to log the model’s reasoning text? Not usually. The tool it picked, the arguments it produced, and the options it had explain most decisions. Where a provider exposes reasoning content, store it only for failed runs and treat it as sensitive.
How do I trace across multiple agents? Keep one trace ID for the whole task and give each agent its own span, with the handoff recorded as an event. Our post on multi-agent handoff covers what belongs in that handoff record.
What if the agent runs on a customer’s machine? Log locally, redact aggressively, and send only aggregate metrics unless the user opts in. Tool names, outcomes, and durations are usually enough for fleet-level monitoring without any payloads leaving the device.
Is a request body hash actually useful? Yes, for the most common questions. It proves two calls were identical, which resolves most duplicate-write investigations, without keeping the payload itself. Pair it with the idempotency keys that should have prevented the duplicate.