Debugging in JavaScript can be a daunting task, especially when you’re new to the language. But don’t worry, we’ve got you covered! In this blog post, we’ll take you through the basics of debugging in JavaScript in a conversational tone. We’ll use active voice and transition words to make it easy to follow along. We’ll also provide creative and SEO-friendly titles for each section, so you can easily navigate through the post.
Debugging is an essential part of programming. It’s the process of finding and fixing errors in your code. In JavaScript, debugging can be particularly challenging because it’s an interpreted language. This means that errors can occur at runtime, making them harder to detect. But with the right tools and techniques, debugging in JavaScript can be a breeze.
Understanding the Basics of Debugging in JavaScript
Before we dive into the specifics of debugging in JavaScript, let’s first understand the basics. Debugging plays a crucial role in JavaScript development. It allows developers to identify and eliminate errors or bugs in their code, ensuring that the program runs smoothly and as intended. Without proper debugging techniques, coding errors can lead to unexpected behavior, crashes, or even security vulnerabilities. Debugging is not only about fixing errors but also a way to improve the overall quality of your code and enhance the user experience.
The Challenges of Debugging in JavaScript
JavaScript is a versatile and dynamic language, but it also presents unique challenges when it comes to debugging. Due to its loose typing and asynchronous nature, bugs can be difficult to track down, especially in complex applications. Additionally, JavaScript code often interacts with APIs (Application Programming Interfaces), which can introduce additional layers of complexity. However, with the right tools and techniques, you can overcome these challenges and become a master debugger.
Why Debugging APIs is Important
APIs are an essential part of modern web development. They allow you to interact with external services and data sources, such as social media platforms, payment gateways, and weather services. Debugging APIs can be challenging, as it requires you to understand how the API works and how to interact with it effectively.
Debugging APIs is important because it helps you identify and resolve issues with your code that are related to the API. For example, if you are using an API to retrieve data for your application, you may encounter issues with the data that is returned. Debugging the API can help you identify the root cause of the issue and resolve it quickly.
To debug APIs in JavaScript, it is important to use the right tools and techniques. One of the most useful tools for API testing and debugging is Apidog.
Choosing a Suitable Integrated Development Environment (IDE)
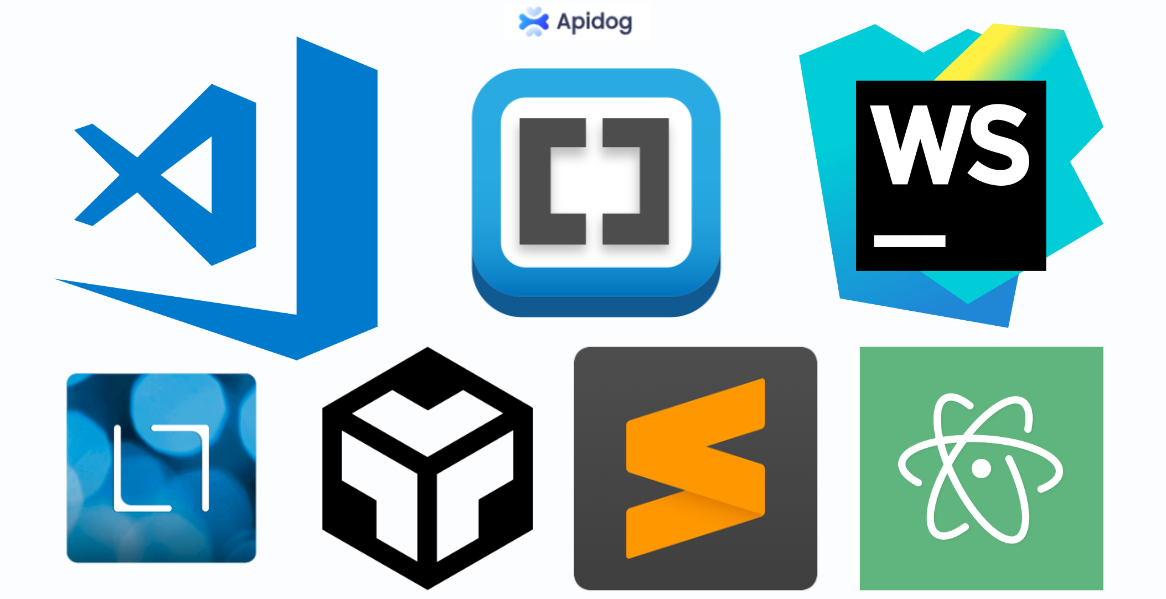
To start debugging JavaScript code effectively, it is essential to choose a suitable Integrated Development Environment (IDE). IDEs such as Visual Studio Code, WebStorm, or Atom provide powerful debugging capabilities, including breakpoints, variable inspection, and step-by-step execution. These features make it easier to identify and fix bugs in your code. Select an IDE that aligns with your preferences and offers robust debugging support.
Installing the Necessary Browser Extensions
Browser extensions can greatly enhance your debugging experience. Extensions like Chrome DevTools, Firefox Developer Tools, or Microsoft Edge DevTools provide a wealth of debugging features specific to web development. These tools allow you to inspect the DOM, monitor network requests, and debug JavaScript code directly within the browser. Make sure to install the relevant browser extensions for your preferred development environment.

Employing Effective Debugging Techniques
In JavaScript, there are several ways to debug your code. One of the most common ways is to use the built-in debugger keyword. This keyword allows you to pause the execution of your code and inspect the values of variables and expressions.
Using the Debugger Keyword
The debugger keyword is a powerful tool for debugging in JavaScript. To use it, simply add the keyword “debugger” to your code where you want to pause the execution. When the code reaches that point, it will pause, and you can use the browser’s developer tools to inspect the values of variables and expressions.
Here is an example of how to use the debugger keyword in JavaScript:
// A function that calculates the factorial of a number
function factorial(n) {
  // Add the debugger keyword to pause the execution here
  debugger;
  // If n is zero or one, return one
  if (n === 0 || n === 1) {
    return 1;
  }
  // Otherwise, return n times the factorial of n-1
  return n * factorial(n - 1);
}

// Call the function with 5 as an argument
factorial(5);
Using Console.log for Debugging
Another common way to debug in JavaScript is to use console.log. Logging is a tried-and-true method for debugging JavaScript code. By strategically placing console.log statements in your code, you can output relevant information to the console and gain insights into the program's execution flow. This technique is particularly useful for tracking variable values, identifying code paths, and verifying the correctness of your logic. With the help of console output, you can trace the source of bugs and make informed decisions to fix them effectively.
Here is an example of how to use console.log for debugging in JavaScript:
// A function that checks if a number is even or odd
function isEven(n) {
  // Log the input value to the console
  console.log("Input: " + n);
  // If n is divisible by 2, return true
  if (n % 2 === 0) {
    return true;
  }
  // Otherwise, return false
  return false;
}

// Call the function with 10 as an argument
isEven(10);
The console output will look something like this:
Input: 10
true
This way, you can see what value the function is receiving and what value it is returning. You can also use console.log to check the values of variables and expressions at different points in your code or to display messages that indicate which code path is being executed.
Using Breakpoints
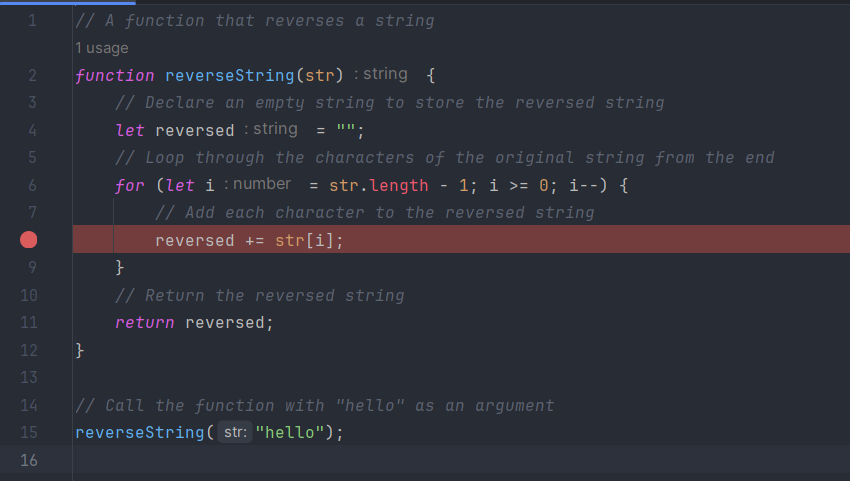
Breakpoints are another powerful tool for debugging in JavaScript. By placing breakpoints in your code, you can pause the execution at specific lines and inspect the program's state at that point. This allows you to identify the cause of errors or unexpected behavior. Modern IDEs and browser developer tools offer intuitive ways to set breakpoints, making it easier than ever to pinpoint and resolve issues in your JavaScript code.
// A function that reverses a string
function reverseString(str) {
  // Declare an empty string to store the reversed string
  let reversed = "";
  // Loop through the characters of the original string from the end
  for (let i = str.length - 1; i >= 0; i--) {
    // Add each character to the reversed string
    reversed += str[i];
  }
  // Return the reversed string
  return reversed;
}

// Call the function with "hello" as an argument
reverseString("hello");
To set a breakpoint in this code, you can use the browser’s developer tools and click on the line number where you want to pause the execution.
For example, you can set a breakpoint on line 8 to see the value of the reversed string at each iteration of the loop. When the code reaches that line, it will stop and you can use the console to inspect the variables and expressions.
Using Browser DevTools for Memory Profiling
Memory leaks and excessive memory usage can cause performance issues in your JavaScript applications. Fortunately, browser developer tools provide memory profiling capabilities that allow you to analyze memory usage and identify potential memory leaks. By using the memory profiling tools, you can optimize your code, release unnecessary resources, and ensure your application runs smoothly, even under heavy use.
// A function that creates an array of objects and returns it
function createArray() {
  // Declare an empty array
  let array = [];
  // Loop 100 times
  for (let i = 0; i < 100; i++) {
    // Create an object with a random property
    let obj = {random: Math.random()};
    // Push the object to the array
    array.push(obj);
  }
  // Return the array
  return array;
}

// Call the function and store the result in a global variable
window.array = createArray();
To use the memory profiling tools, you can open the browser’s developer tools and go to the Memory tab. There, you can take a heap snapshot to see the memory allocation of your application. A heap snapshot is a snapshot of the JavaScript heap at a given point in time. It shows you how much memory is used by each object, function, or variable in your code.
By using the memory profiling tools, you can identify memory leaks and optimize your code.
Collaborative Debugging with Remote Debugging Tools
In some cases, you may encounter bugs that only occur in specific environments or devices. Remote debugging tools enable you to connect to remote devices, such as mobile phones or tablets, and debug JavaScript code running on those devices. This allows you to reproduce and fix bugs that are difficult to replicate locally. Remote debugging tools facilitate collaboration among developers, making it easier to solve complex issues that span across different platforms.
Debugging APIs with Apidog
One of the most popular tools for debugging APIs is Apidog. Apidog is a powerful tool for debugging APIs. It provides a range of features that make it easy to debug your APIs. One of the standout features of Apidog is its ability to facilitate automation testing. With Apidog, you can debug your APIs and perform API Mocking and automation testing—all within the same platform. This fosters better communication, reduces the risk of misunderstandings, and accelerates issue resolution.
Apidog is available as a browser extension or a standalone application. Install the extension or download the application from the official website. Once installed, configure Apidog to intercept network requests and enable the desired debugging features.
Apidog allows you to intercept and inspect API requests made by your JavaScript code. When a request is sent, Apidog captures the request details, including the request method, URL, headers, and payload data. You can then inspect these details and gain a deeper understanding of how your code interacts with the API. This feature is invaluable for identifying issues such as incorrect request parameters or missing headers.
Debugging with Apidog is easy. Once enter the details of your API, including the endpoint and request parameters, you can easily inspect the response and debug your API with the debug mode.
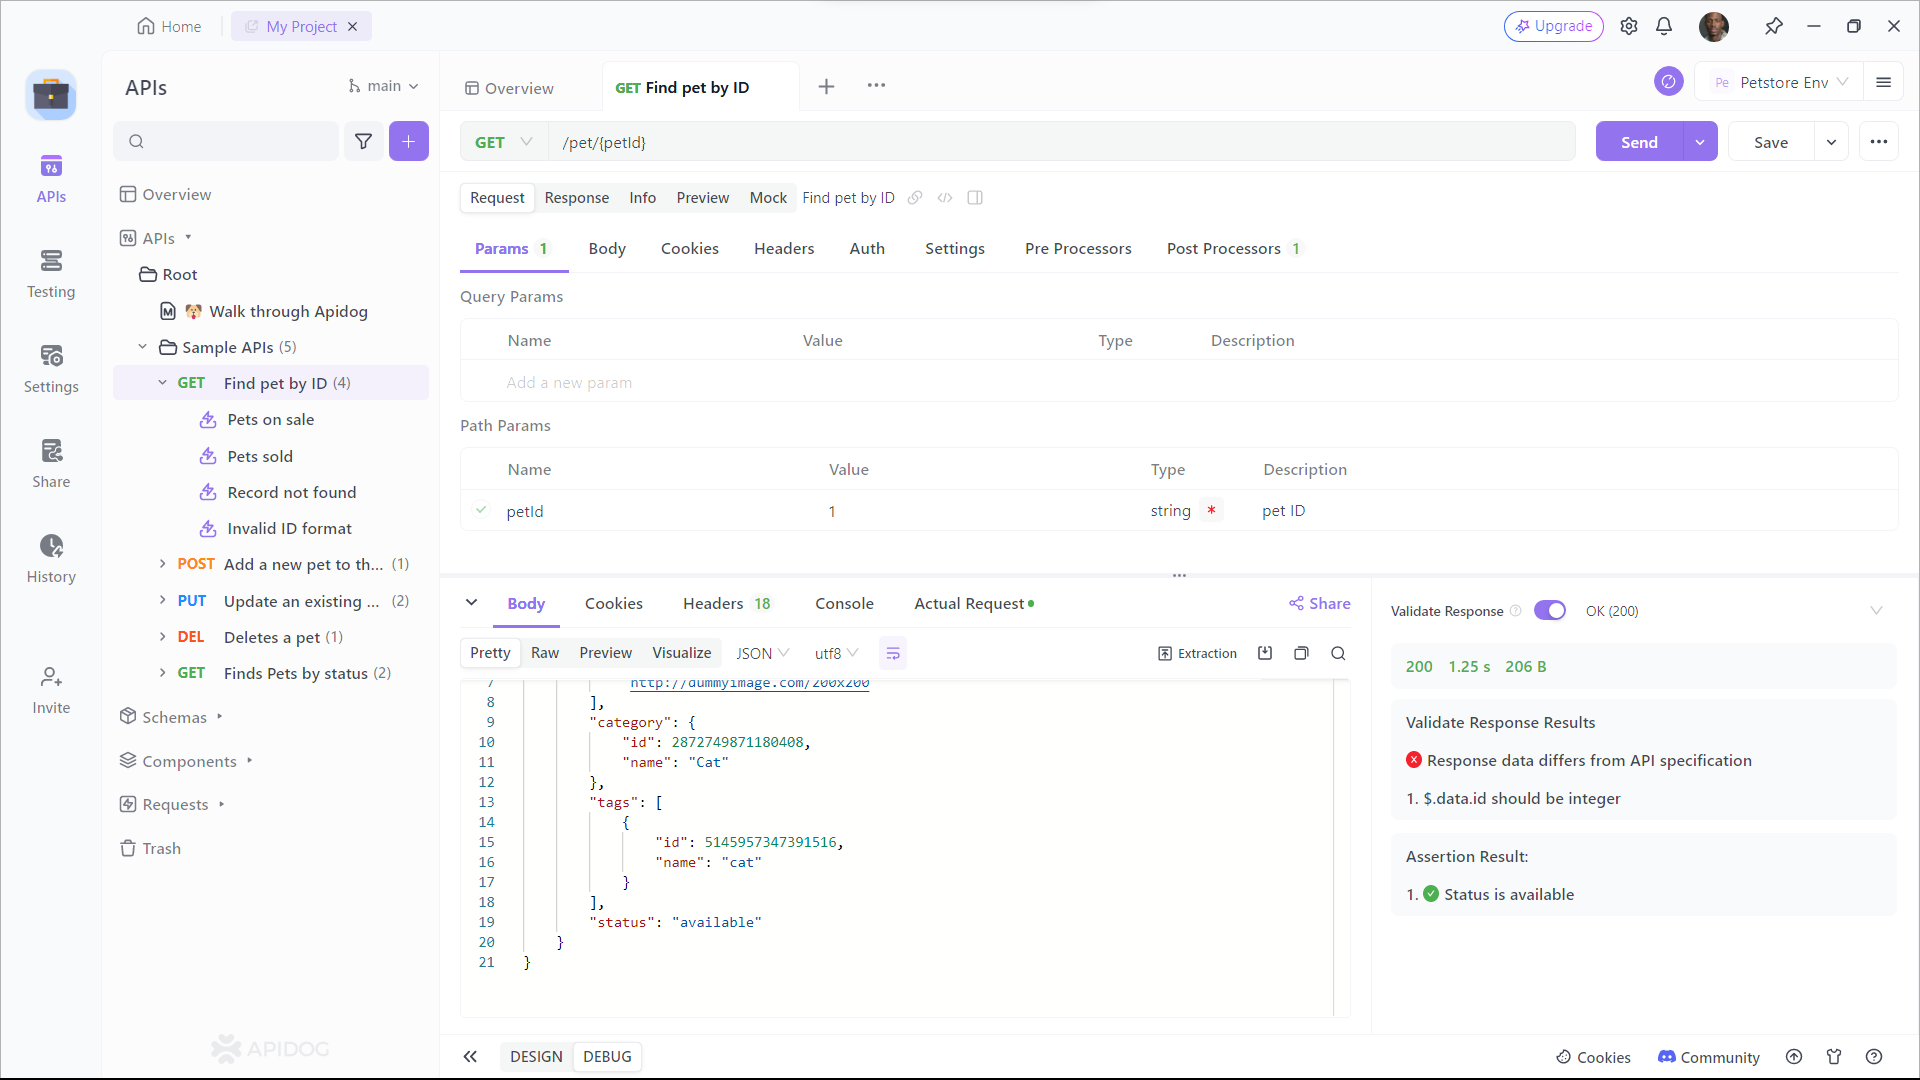
In addition to inspecting requests, Apidog enables you to manipulate API responses. This feature is particularly useful when testing error handling or edge cases in your code. With Apidog, you can modify the response data, status codes, or headers to simulate different scenarios and ensure your code behaves correctly under various conditions. By manipulating API responses, you can thoroughly test your code and catch potential bugs before they reach production.
Debugging with Apidog - Best Practices
Debugging with Apidog can be challenging, but there are several best practices you can follow to make it easier. Here are some tips to help you debug your APIs more effectively:
- Use descriptive names for your APIs and endpoints.
- Use meaningful error messages.
- Test your APIs thoroughly before deploying them.
- Use automation testing to reduce the risk of human error.
- Keep your APIs up to date with the latest security patches.
Conclusion
Debugging in JavaScript can be challenging, but with the right tools and techniques, it can be a breeze. In this blog post, we’ve covered the basics of debugging in JavaScript and provided several tips and best practices to help you debug your APIs more effectively.
In addition to the techniques mentioned above, it's important to stay updated on the latest debugging tools and practices. Keeping up with industry trends and advancements can help you stay ahead of potential issues and optimize your code even further. Remember to regularly review and refactor your code to ensure it remains efficient and free of any potential memory leaks. With a proactive approach to debugging, you can create high-performing JavaScript applications that deliver exceptional user experiences.
We hope this post has been helpful, and we wish you the best of luck in your debugging endeavors!


