What Can Scheduled Tasks Do?
There's just too much automation it can accomplish. Let me first list a few common use cases:
Social Media Dynamic Monitoring: Track specific user activities regularly and monitor trending topics Data Acquisition and Analysis: Crawl website articles, comment information, etc. on a regular basis Automated Marketing: Automatically post on social media at scheduled intervals Personal Automation: Timing reminders and task management
In the past, implementing these scheduled automated tasks was quite troublesome. It often required mastering a programming language (like Python), configuring a server or cloud platform, or even writing complex scripts to handle various situations. This tended to be a significant barrier for non-technical people or developers with limited time.
But now, with Apidog's "Scheduled Tasks" feature, these automated scenarios are basically easy to handle.
In Apidog, implementing automated timing tasks such as crawlers and monitoring can be roughly divided into the following steps:
- Get API
- Analysis of returned data
- Orchestrate test scenarios
- Set scheduled tasks
Let's explain below how to operate in Apidog based on these steps. Whatever your needs are, the following can give you some inspiration.
Get API
If you want to monitor the social media dynamics of certain platforms, or crawl data from certain platforms, the first step is to obtain the API that implements this operation. So the question arises, where can I find these APIs?
You can go to the official "open platform" to find out if there are any relevant open interfaces. This is the most formal way. Generally, pages that can be displayed at the front end will have corresponding APIs provided.
For example, assuming we want to monitor the number of stars of a certain project on GitHub, we can go to GitHub's open platform at this time to see if there are any relevant APIs provided. If so, just copy them directly.

Token is required to be carried when requesting an open API, and can generally be generated in the developer's background.
In addition to going to the official platform to find the API, you can also choose to capture packets in the browser, or find some open source projects on GitHub. The specific operation method can be viewed in the extended section at the end of this article.
Analysis of Returned Data
Now that we know how to get the relevant API, the next step is to analyze the returned data and see what useful information is in it. In general, these APIs return data in JSON format, and we need to look carefully at what each field stands for.
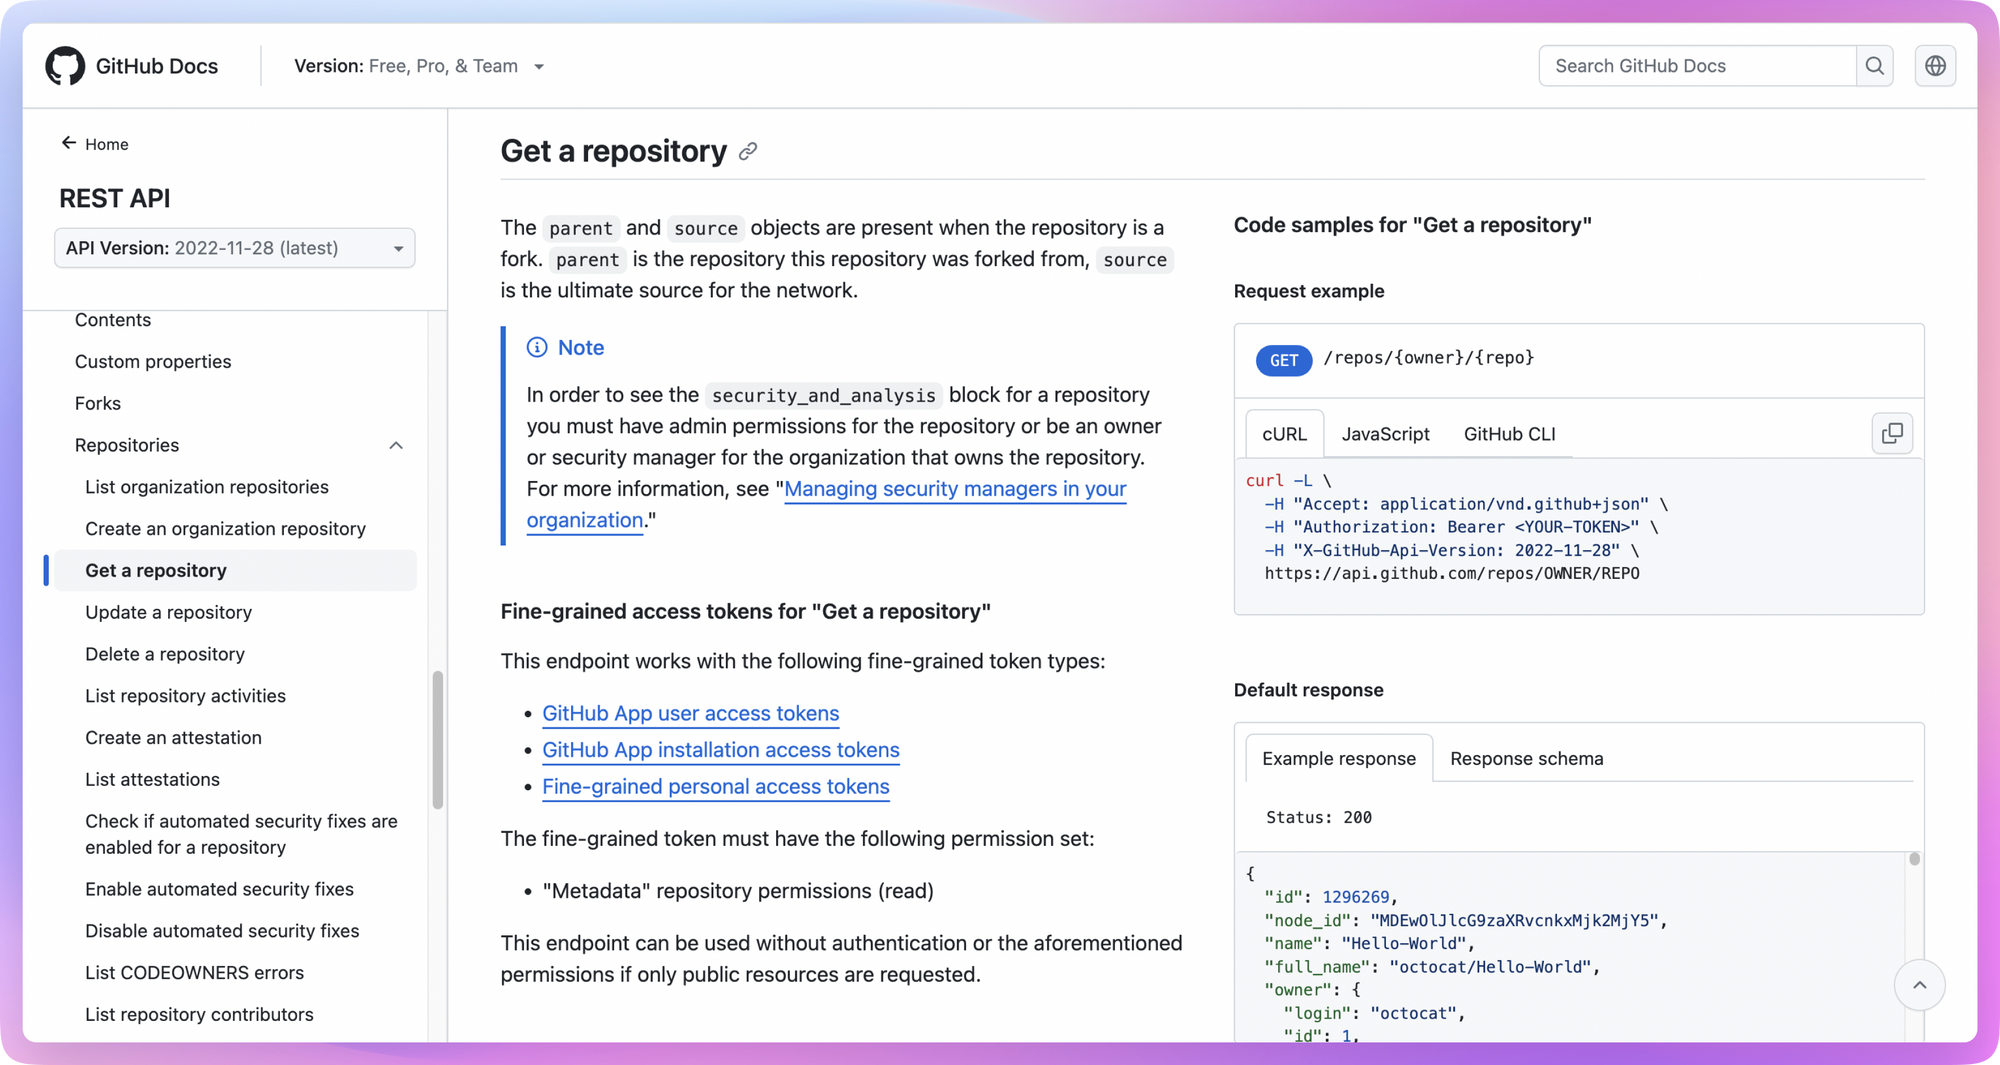
For example, accessing this open API below can obtain warehouse information for specific open source projects on GitHub:
curl -L \
   -H "Accept: application/vnd.github+json" \
   -H "Authorization: Bearer <YOUR-TOKEN>" \
   -H "X-GitHub-Api-Version: 2022-11-28" \
  https://api.github.com/repos/{owner}/{repo}
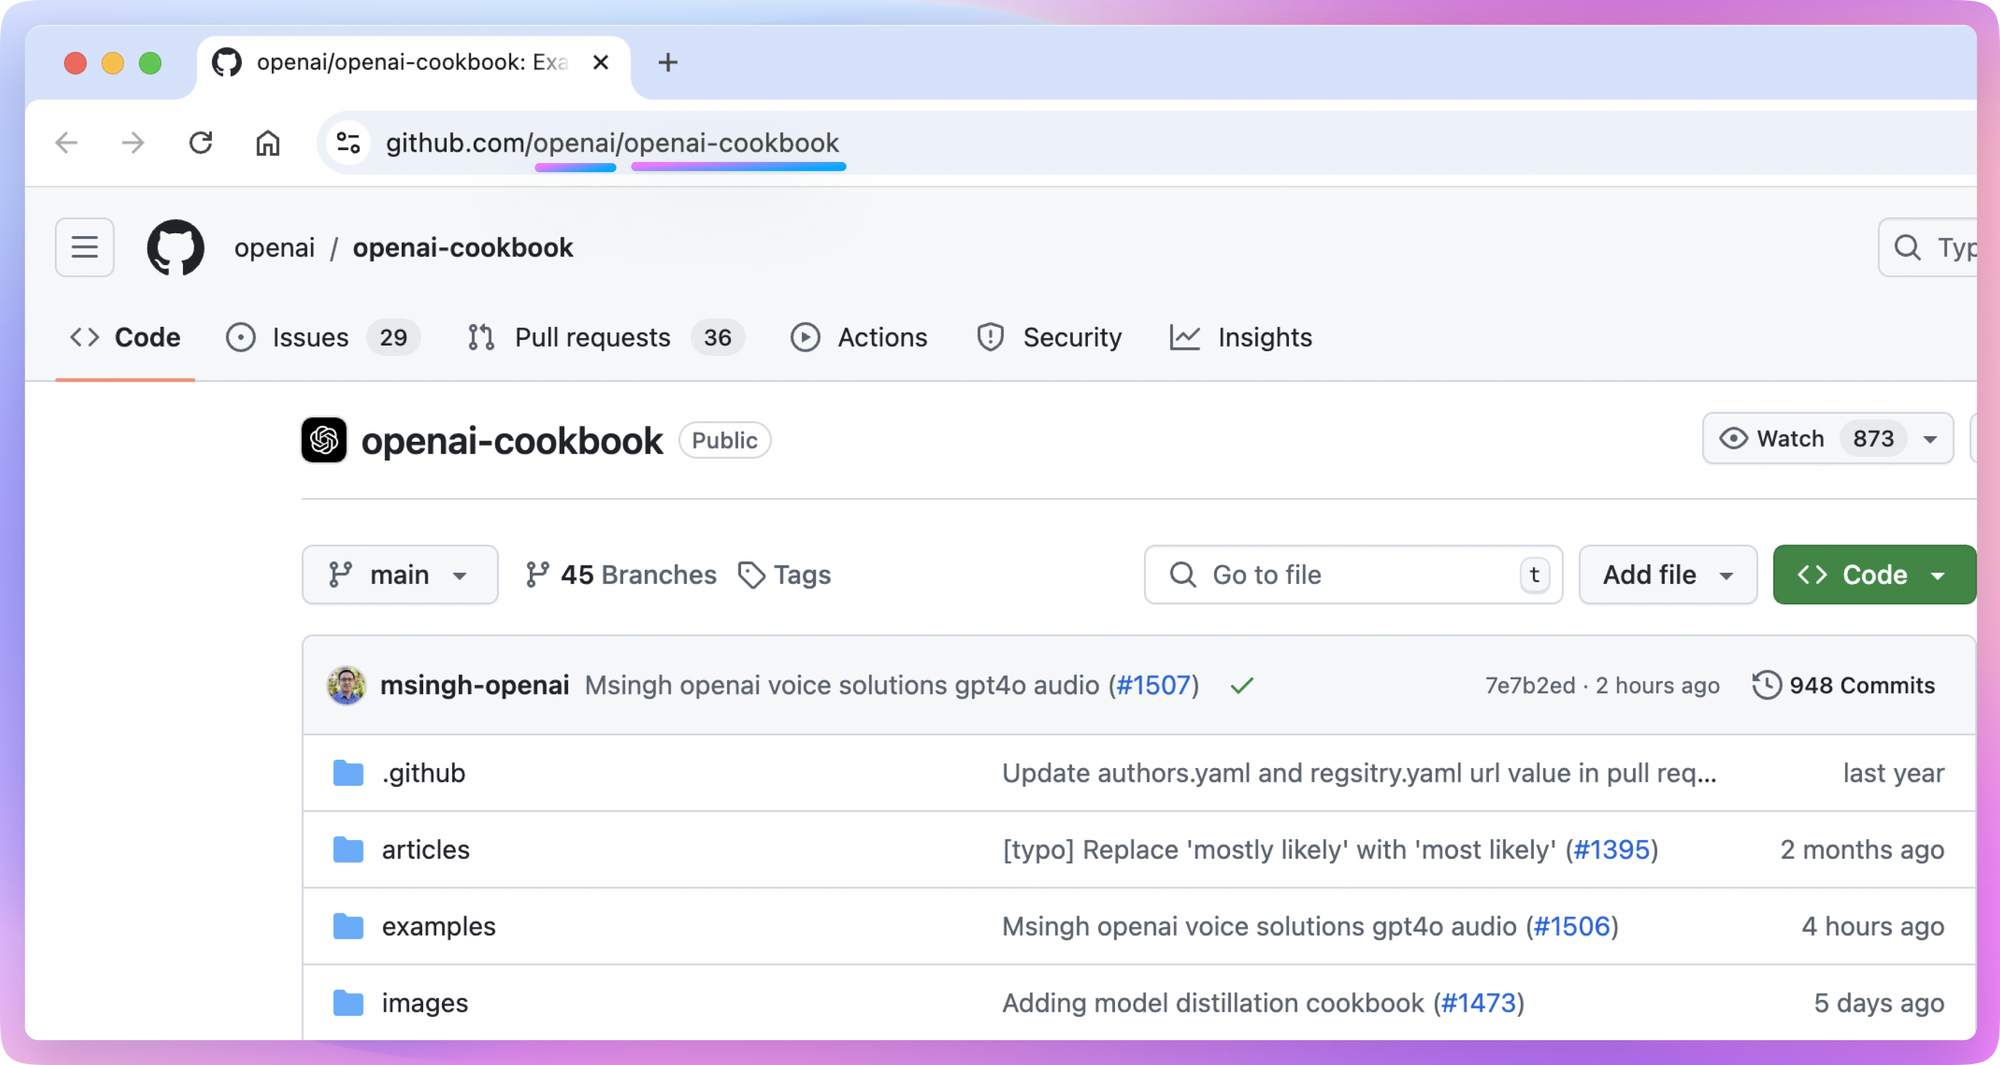
Where {owner} is the username or organization name of the repository owner and {repo} is the name of the repository. To find this information, just look at the URL of the GitHub repository:
- Open the GitHub project page you want to view
- Take a look at the URL in the browser address bar, and it's in this format:
https://github.com/{owner}/{repo} - The part after the first slash in the URL is
{owner}, the part after the second slash is{repo}
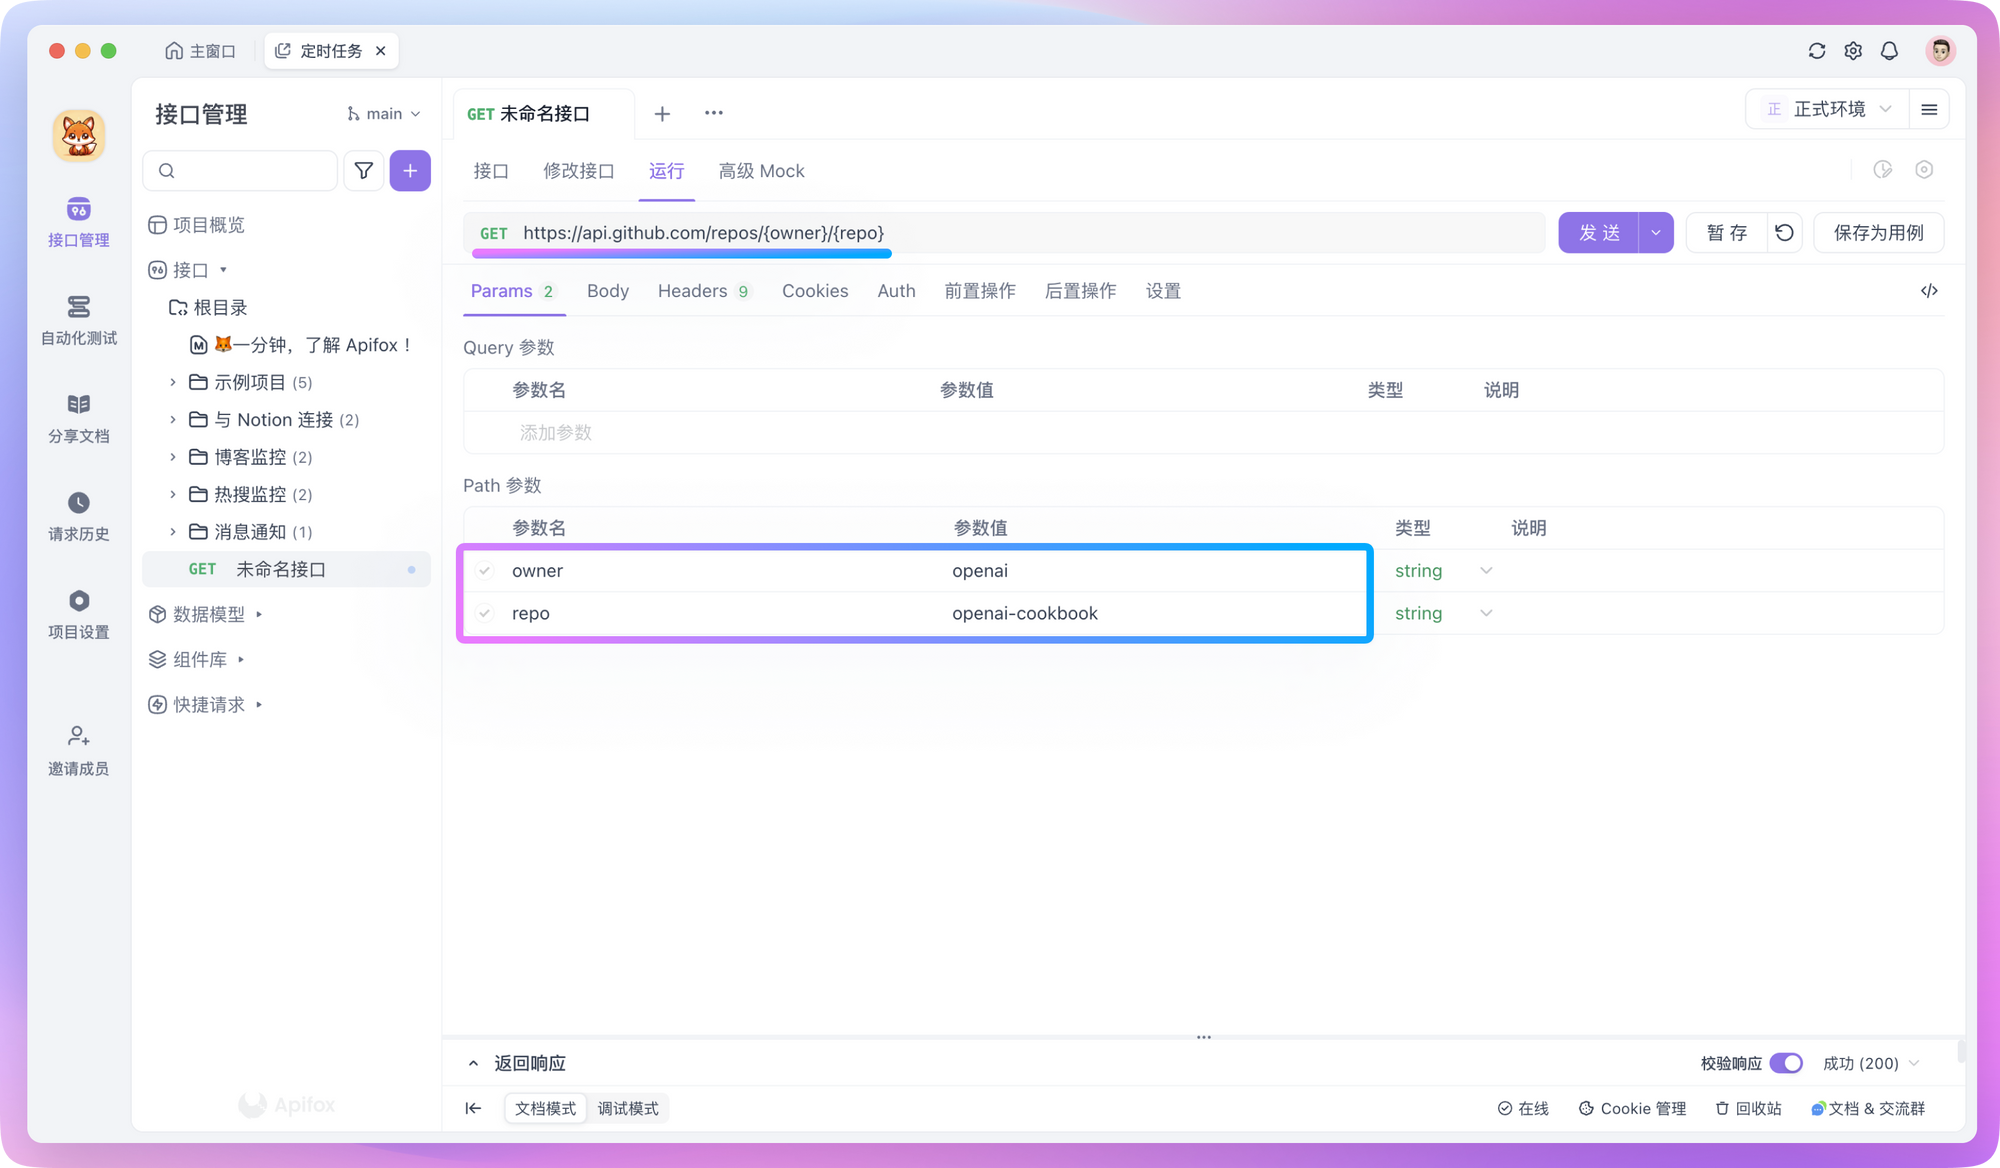
In Apidog, you can directly copy the above cURL command content to create a new API request, or you can manually set the request method and URL while adding Token to the request header.
Once you send a request, you get a JSON response like this:
{
  "id": 468576060,
  "name": "openai-cookbook",
  "full_name": "openai/openai-cookbook",
  "stargazers_count": 59366,
  ...
}
After getting the raw JSON data, the next step is data processing. In Apidog, we can use JSONPath expressions or write simple scripts to achieve this.
For example, to use JSONPath to extract specific fields, you can add an "Extract Variables" operation in the "Post-processors" and fill in the corresponding expression. If you're not familiar with how to write expressions, you can click the icon in the "JSONPath Expression" input box to use the JSONPath extraction tool as an assistant.
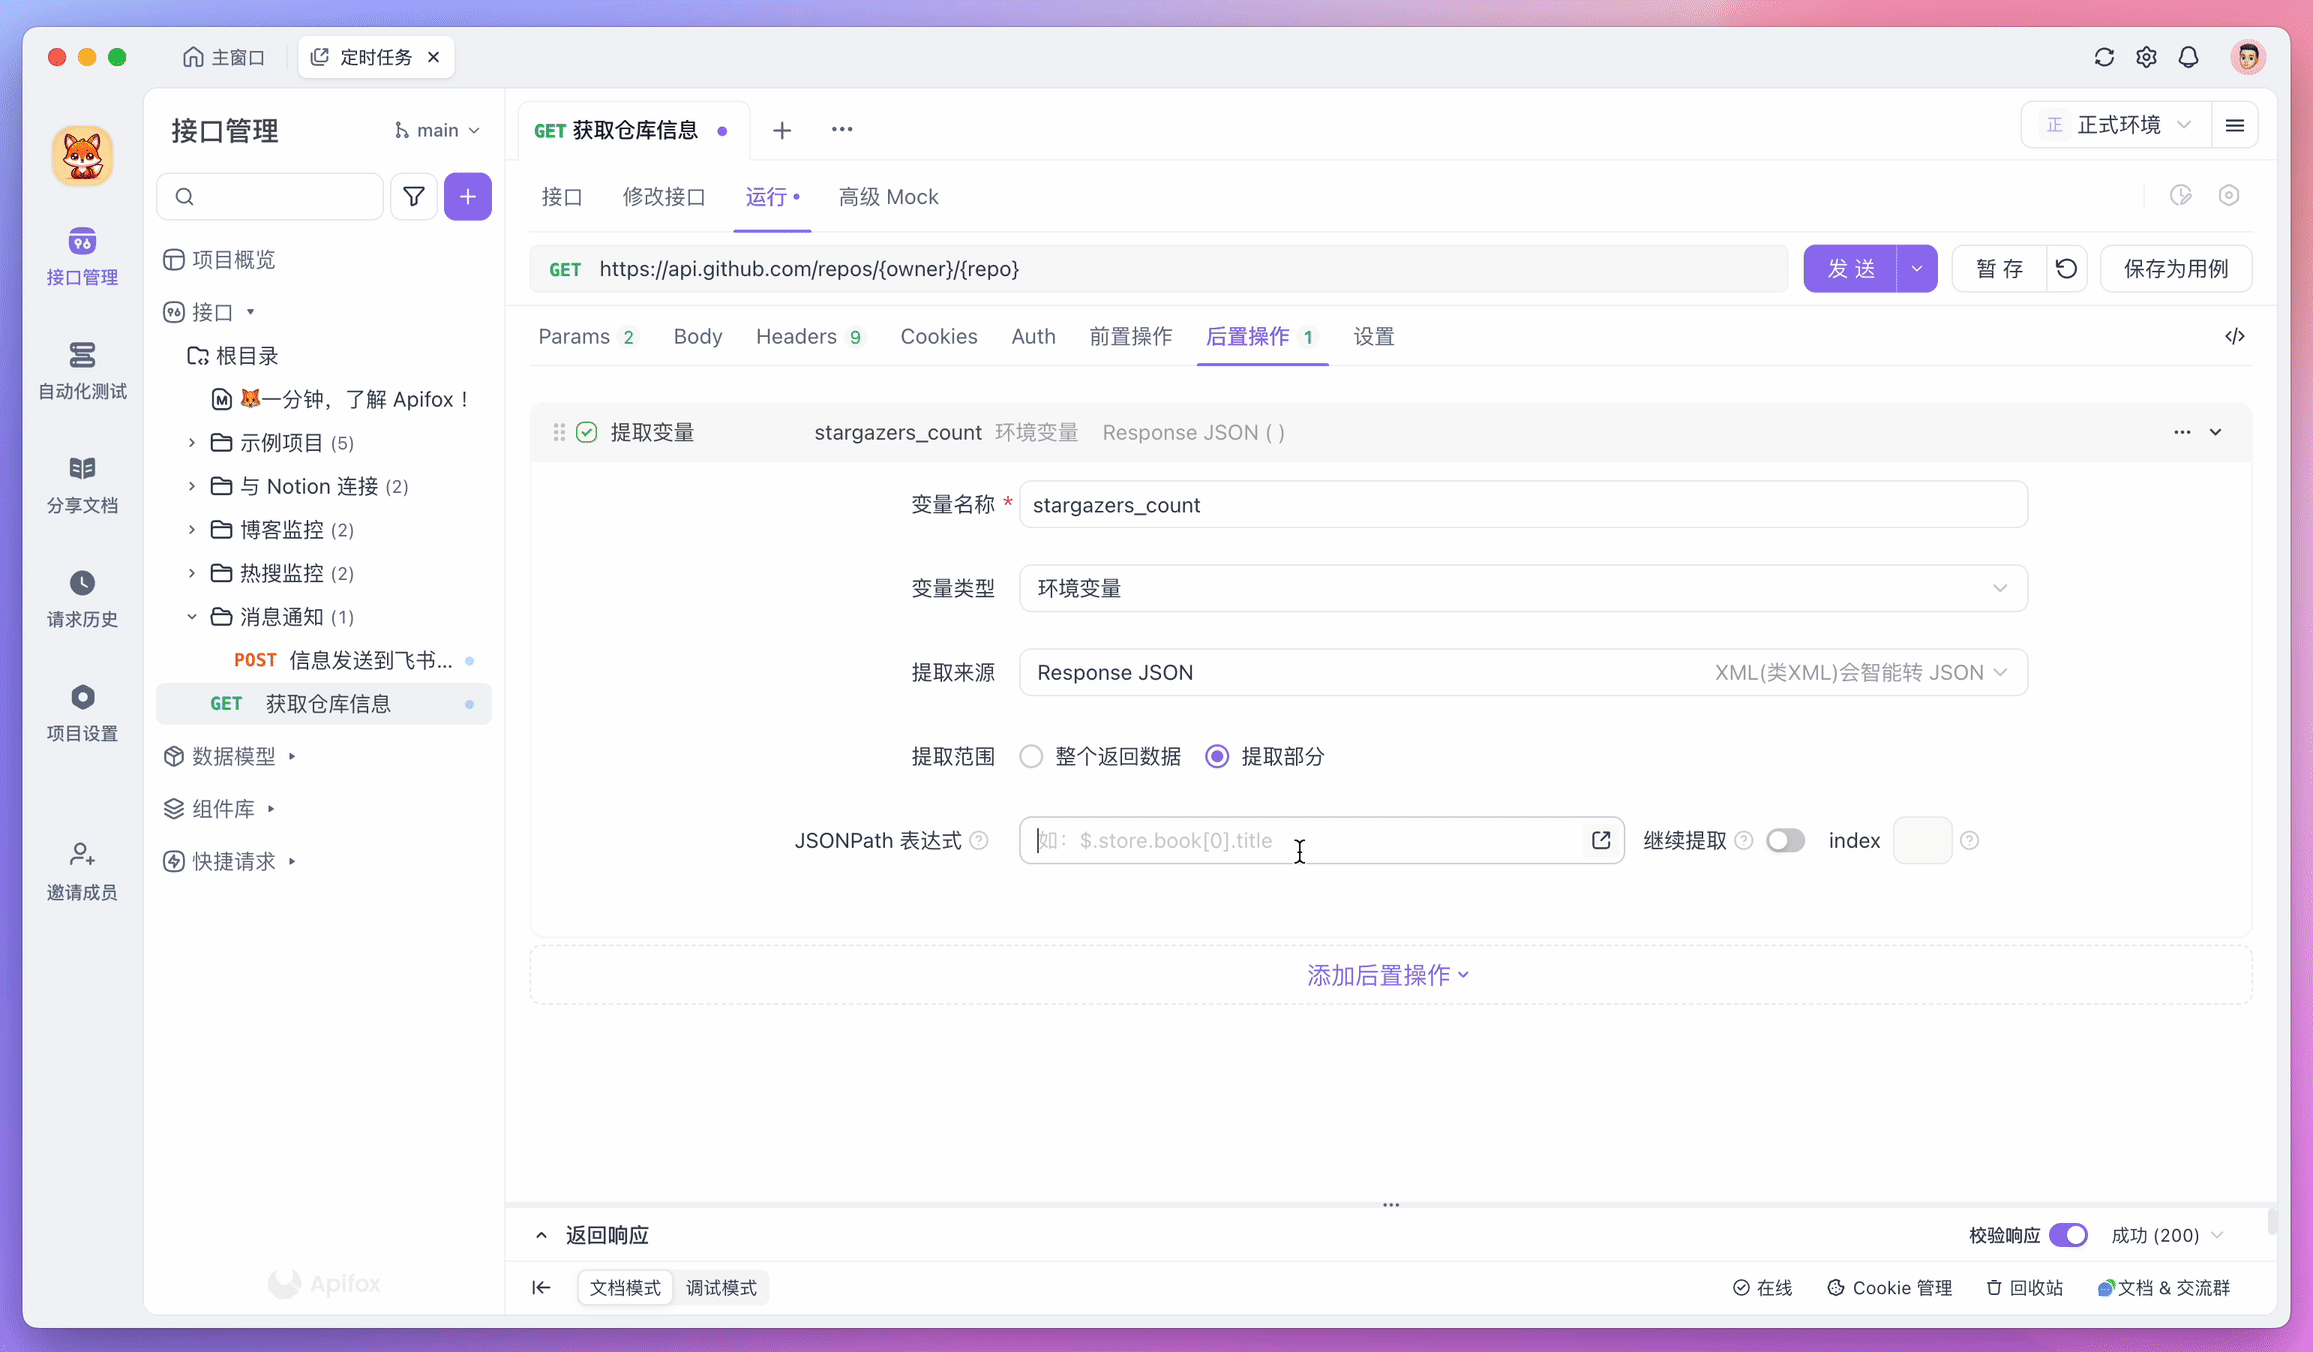
The extracted data will be temporarily stored in environment variables, which can be sent to servers or stored in databases in subsequent steps.
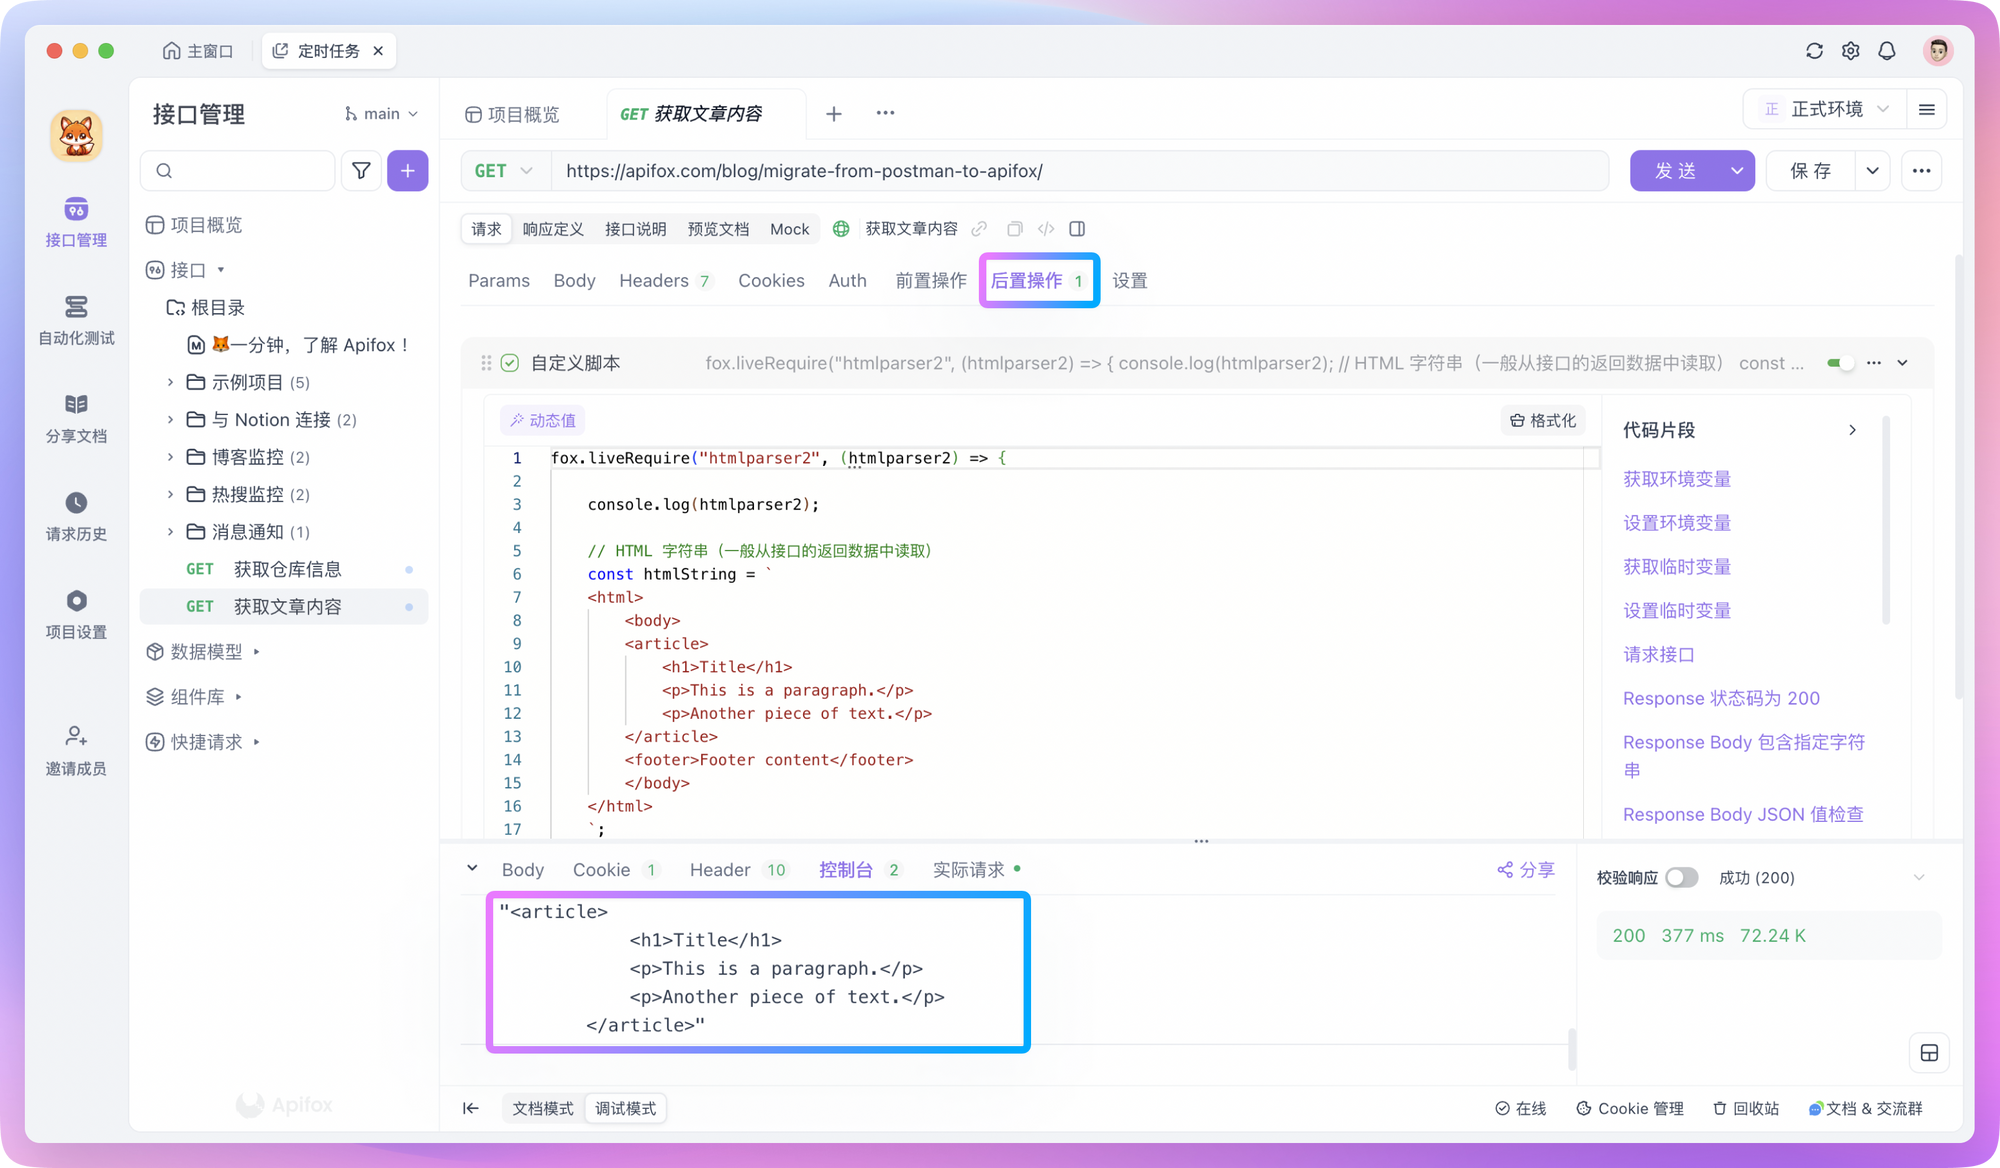
In addition to the common JSON format, there is another type that directly returns the entire HTML document, which is very common in server-side rendering scenarios. For this, we need to use scripts for processing.
In Apidog, you can create a new "Custom Script" in the "Post-processors" and use the fox.liveRequire method to reference the htmlparser2 library to process HTML format data.
For example, if you want to extract all <article> tags and their internal content from an HTML and convert them to text format, you can write a script like this:
fox.liveRequire("htmlparser2", (htmlparser2) => {

    console.log(htmlparser2);

    // HTML string (generally read from interface return data)
    const htmlString = `
    <html>
        <body>
        <article>
            <h1>Title</h1>
            <p>This is a paragraph.</p>
            <p>Another piece of text.</p>
        </article>
        <footer>Footer content</footer>
        </body>
    </html>
    `;

    // Parse document
    const document = htmlparser2.parseDocument(htmlString);

    // Use DomUtils to find <article> tags
    const article = htmlparser2.DomUtils.findOne(elem => elem.name === "article", document.children);

    // Convert content in <article> to complete HTML fragment
    if (article) {
        const articleHTML = htmlparser2.DomUtils.getOuterHTML(article);
        console.log(articleHTML);
    } else {
        console.log("No <article> tag found.");
    }
})
Processing HTML format content through scripts won't be explored too much here. You can simply understand this as "DOM manipulation" - you can ask AI for specific details.
Orchestrate Test Scenarios
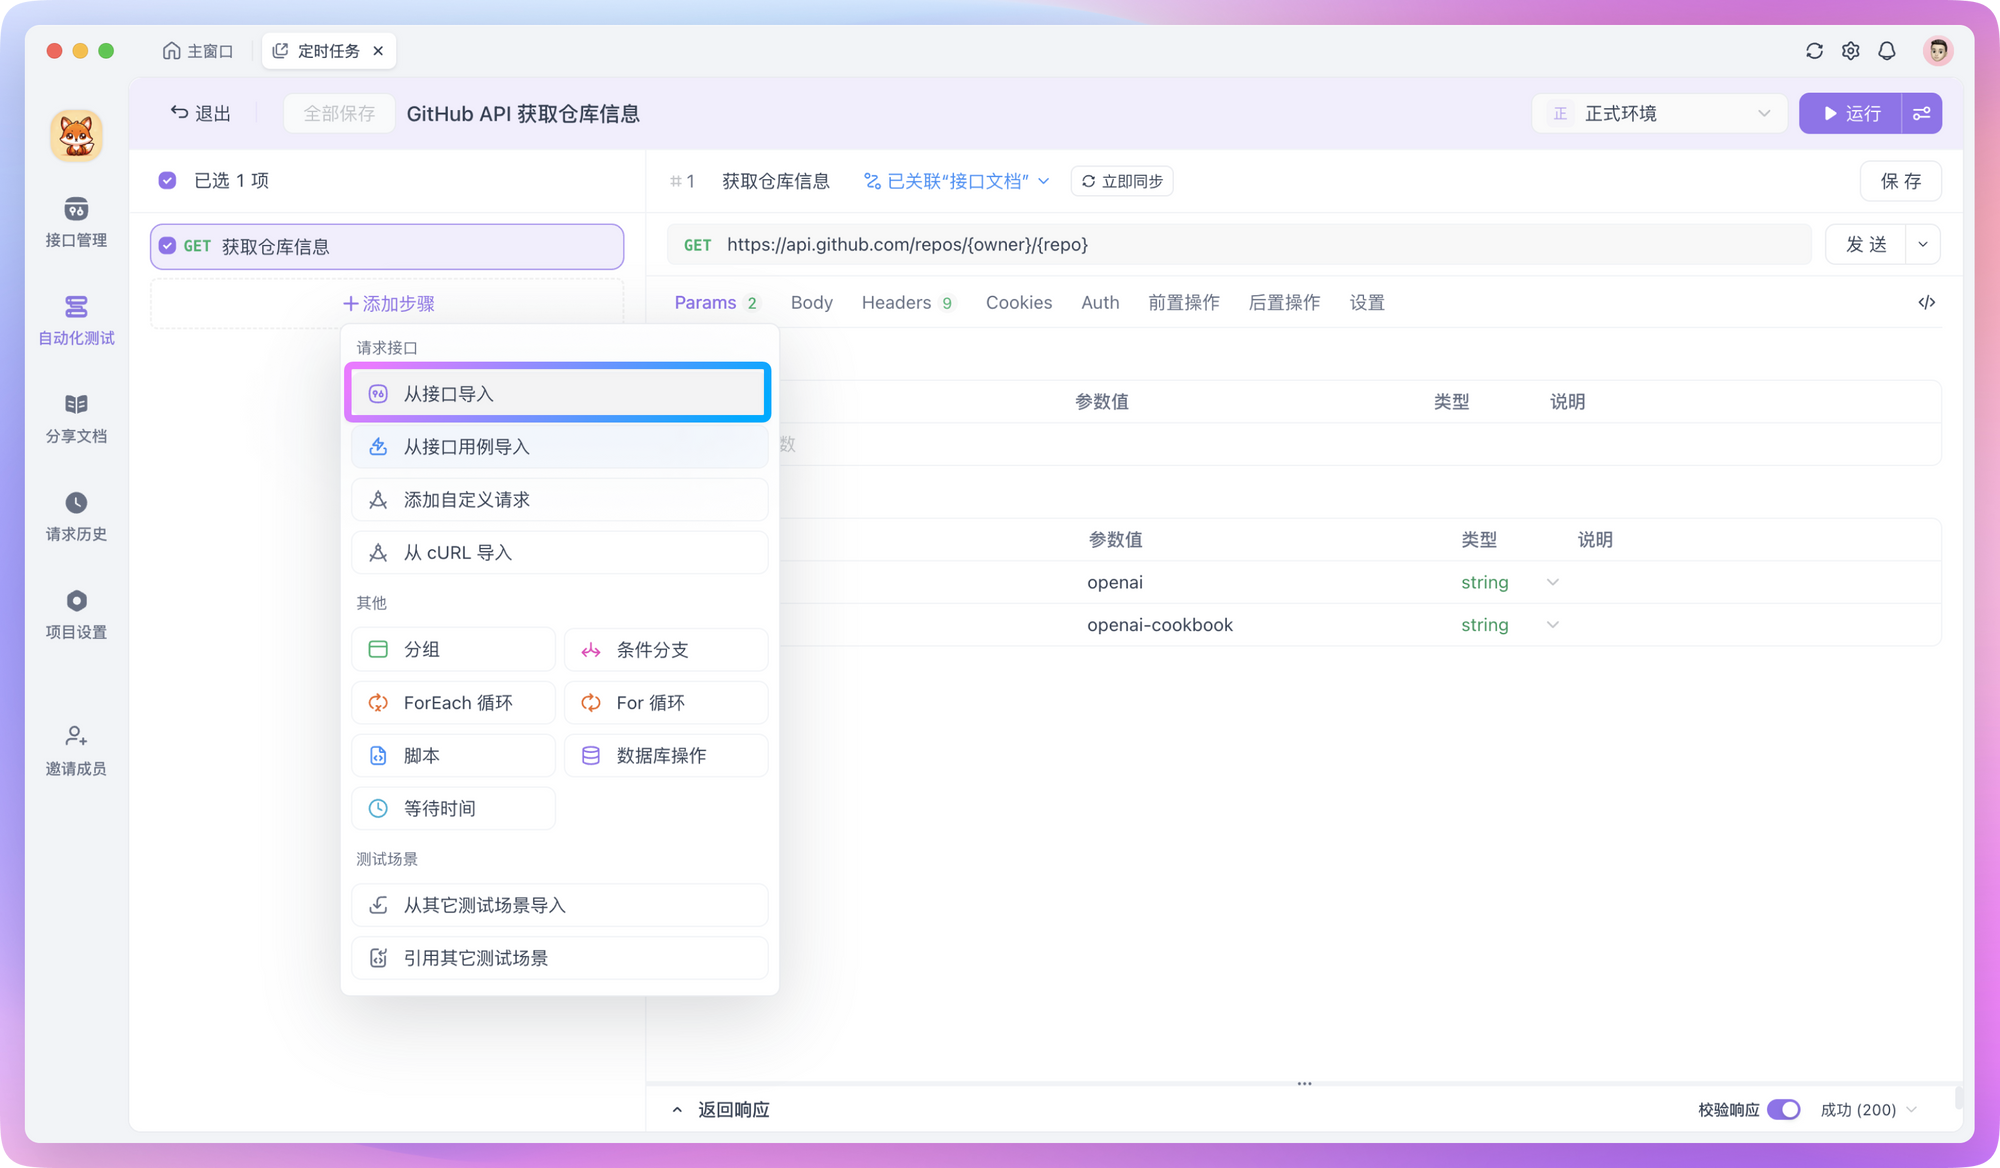
With APIs ready and data analyzed, the next step is to orchestrate test scenarios in automated testing.
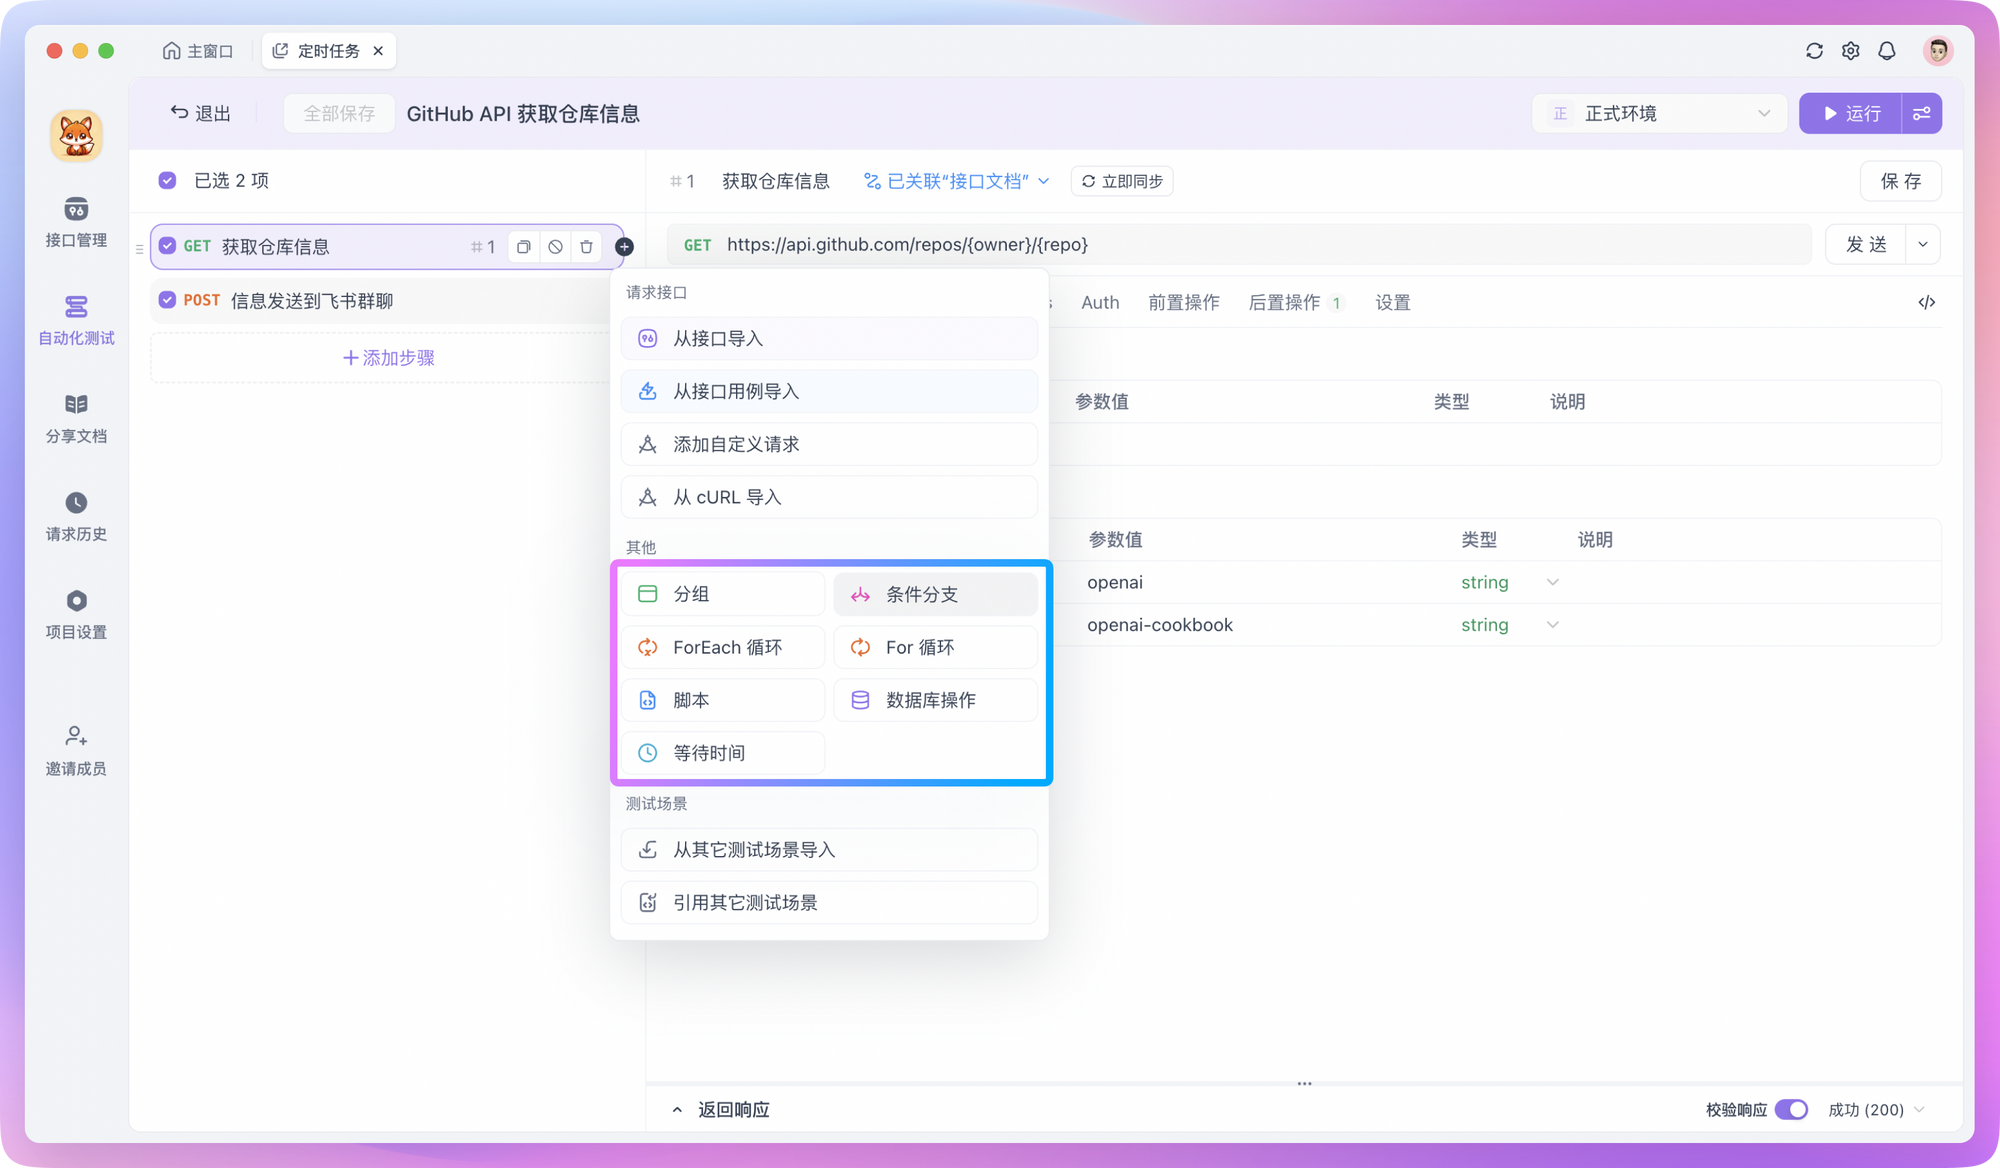
In Apidog, you can create a test scenario in automated testing and import the prepared API requests into it.
If you need to insert processed data into a database, you can create a new "Database Operation" in "Post-processors" and insert the processed data into the database through SQL commands. SQL commands support reading values from environment variables, for example:
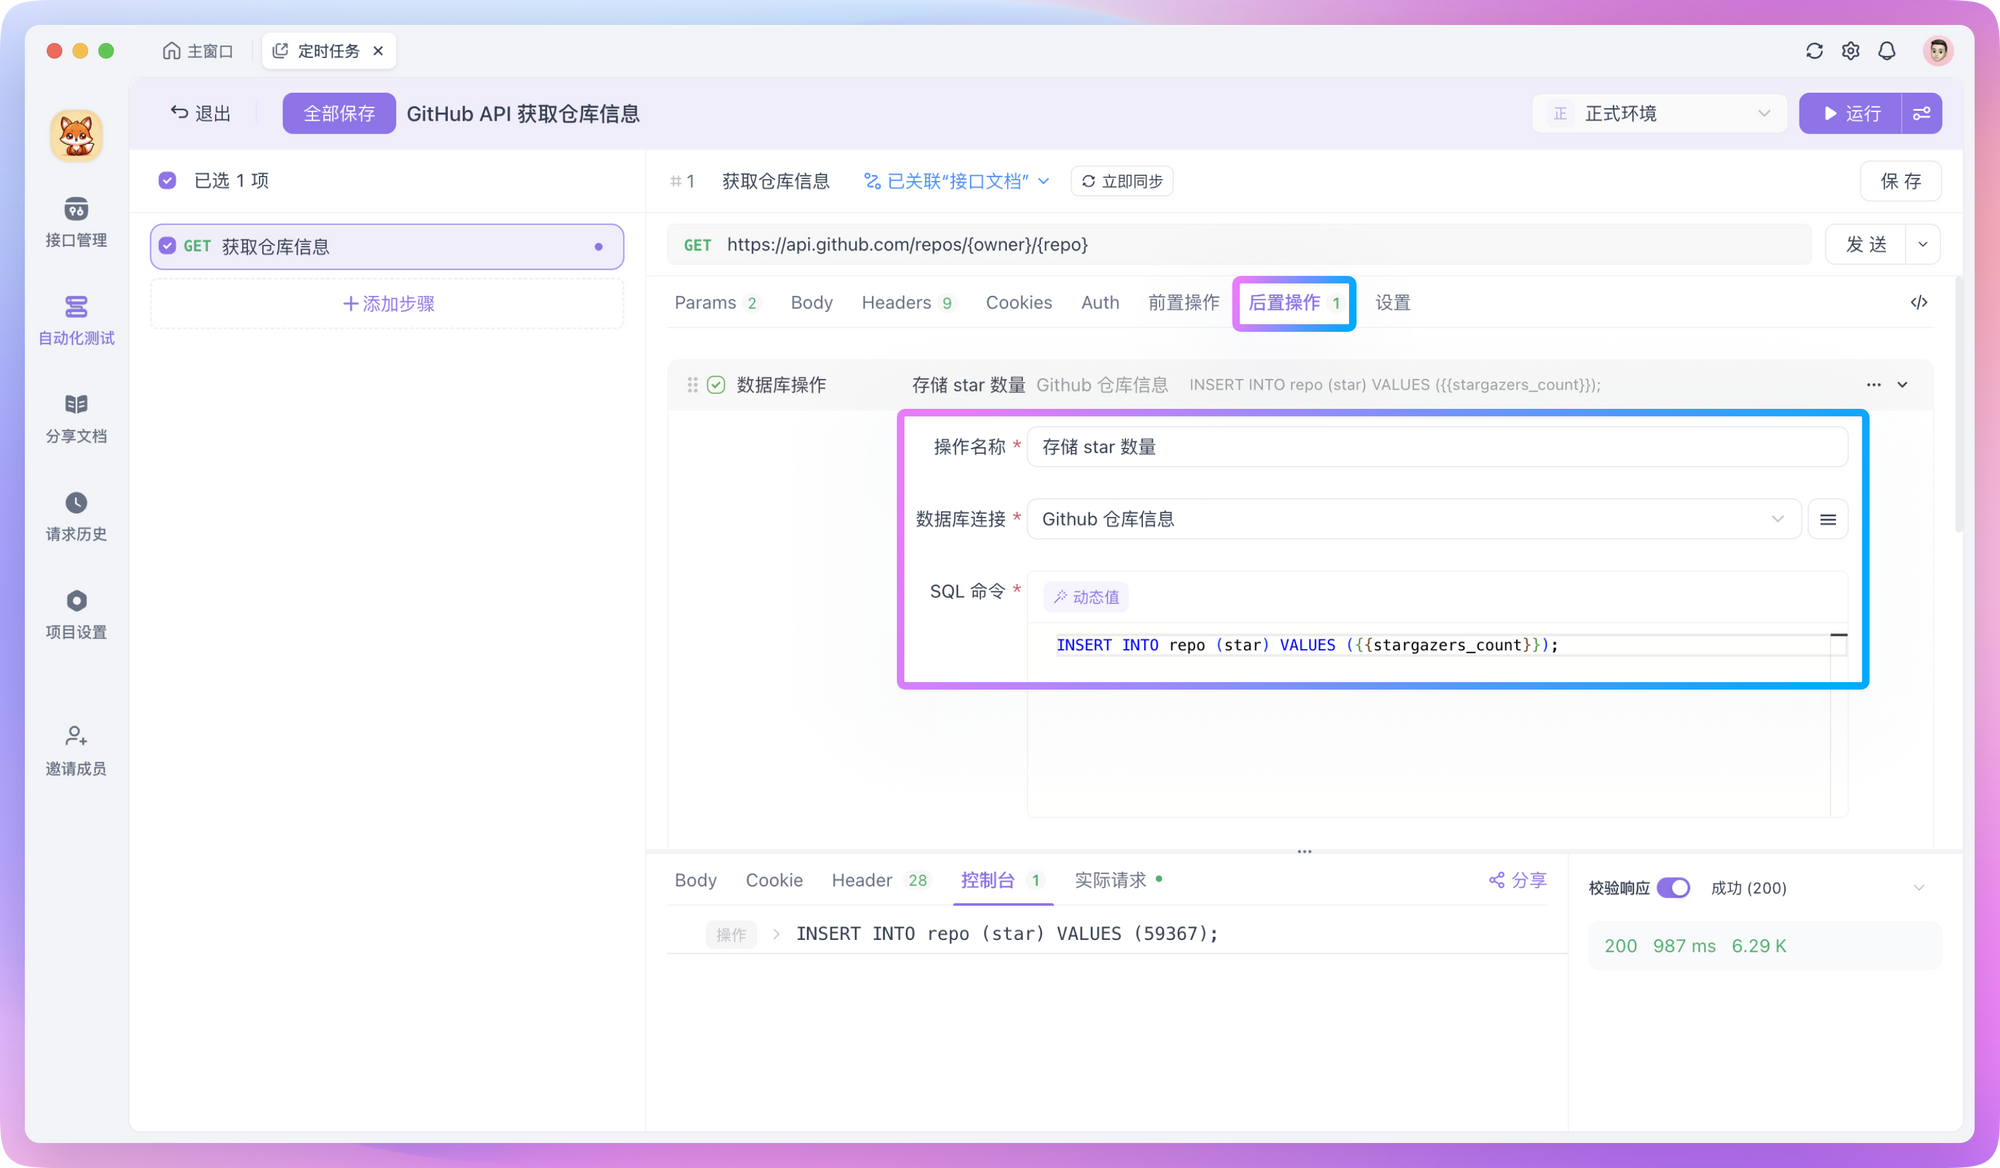
INSERT INTO monitoring_data (project_name, star_count, updated_time)
VALUES ('{{project_name}}', {{star_count}}, NOW())
Additionally, you can store processed data through APIs - that is, write your own API to save data to a server, or send data to third-party platforms through Webhooks.
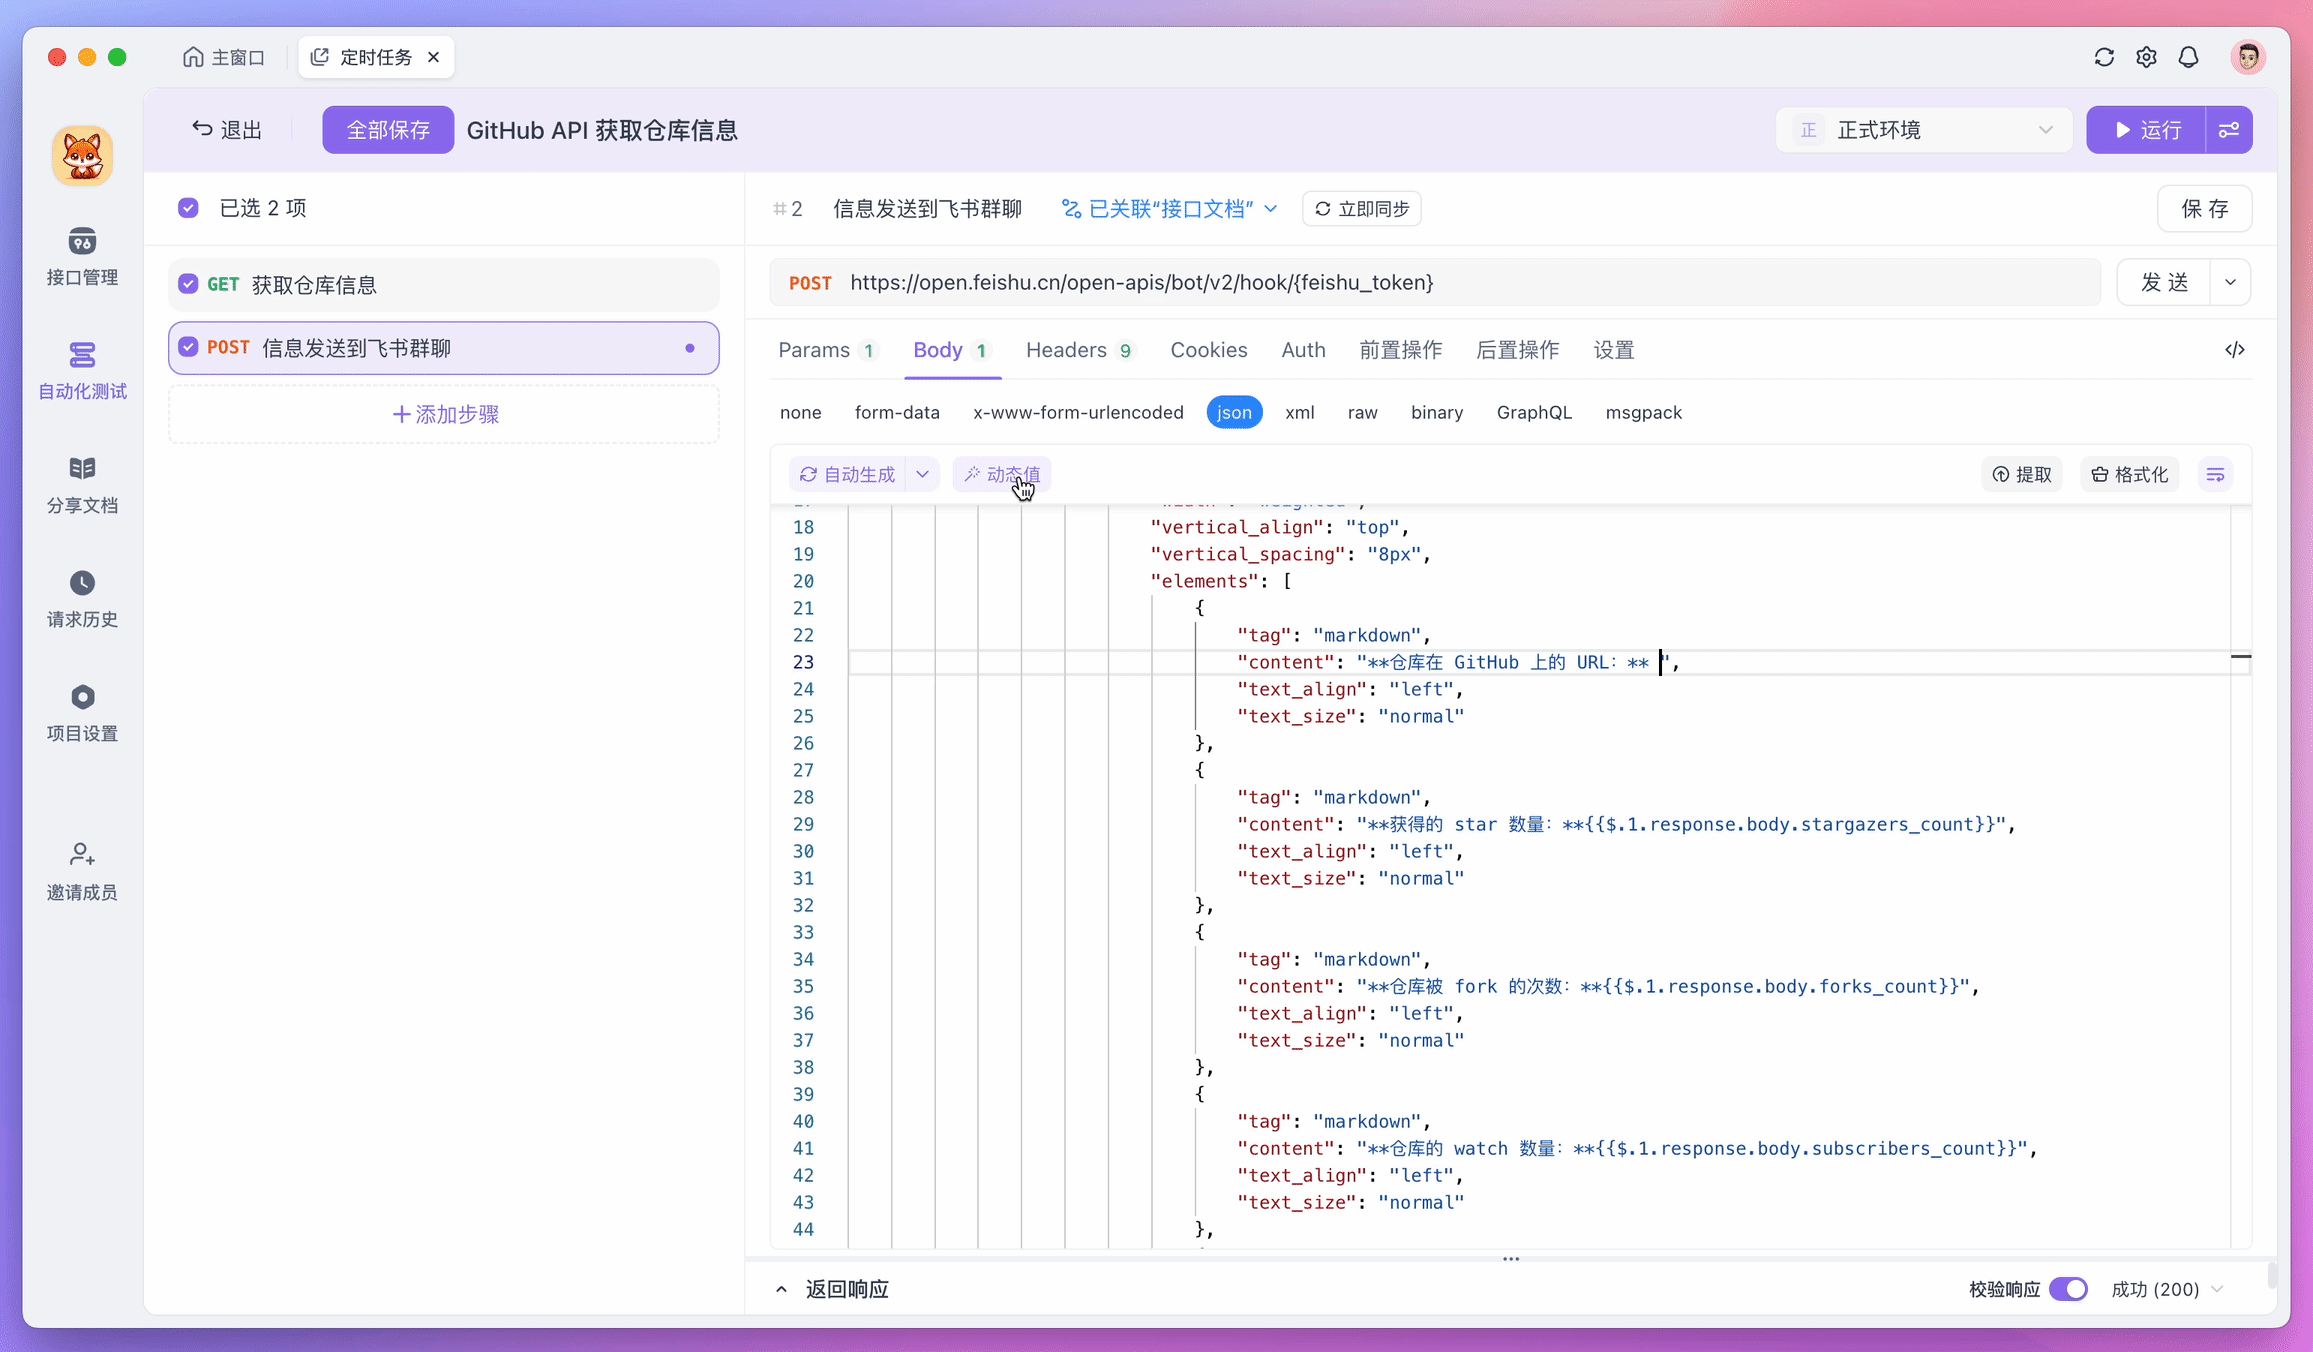
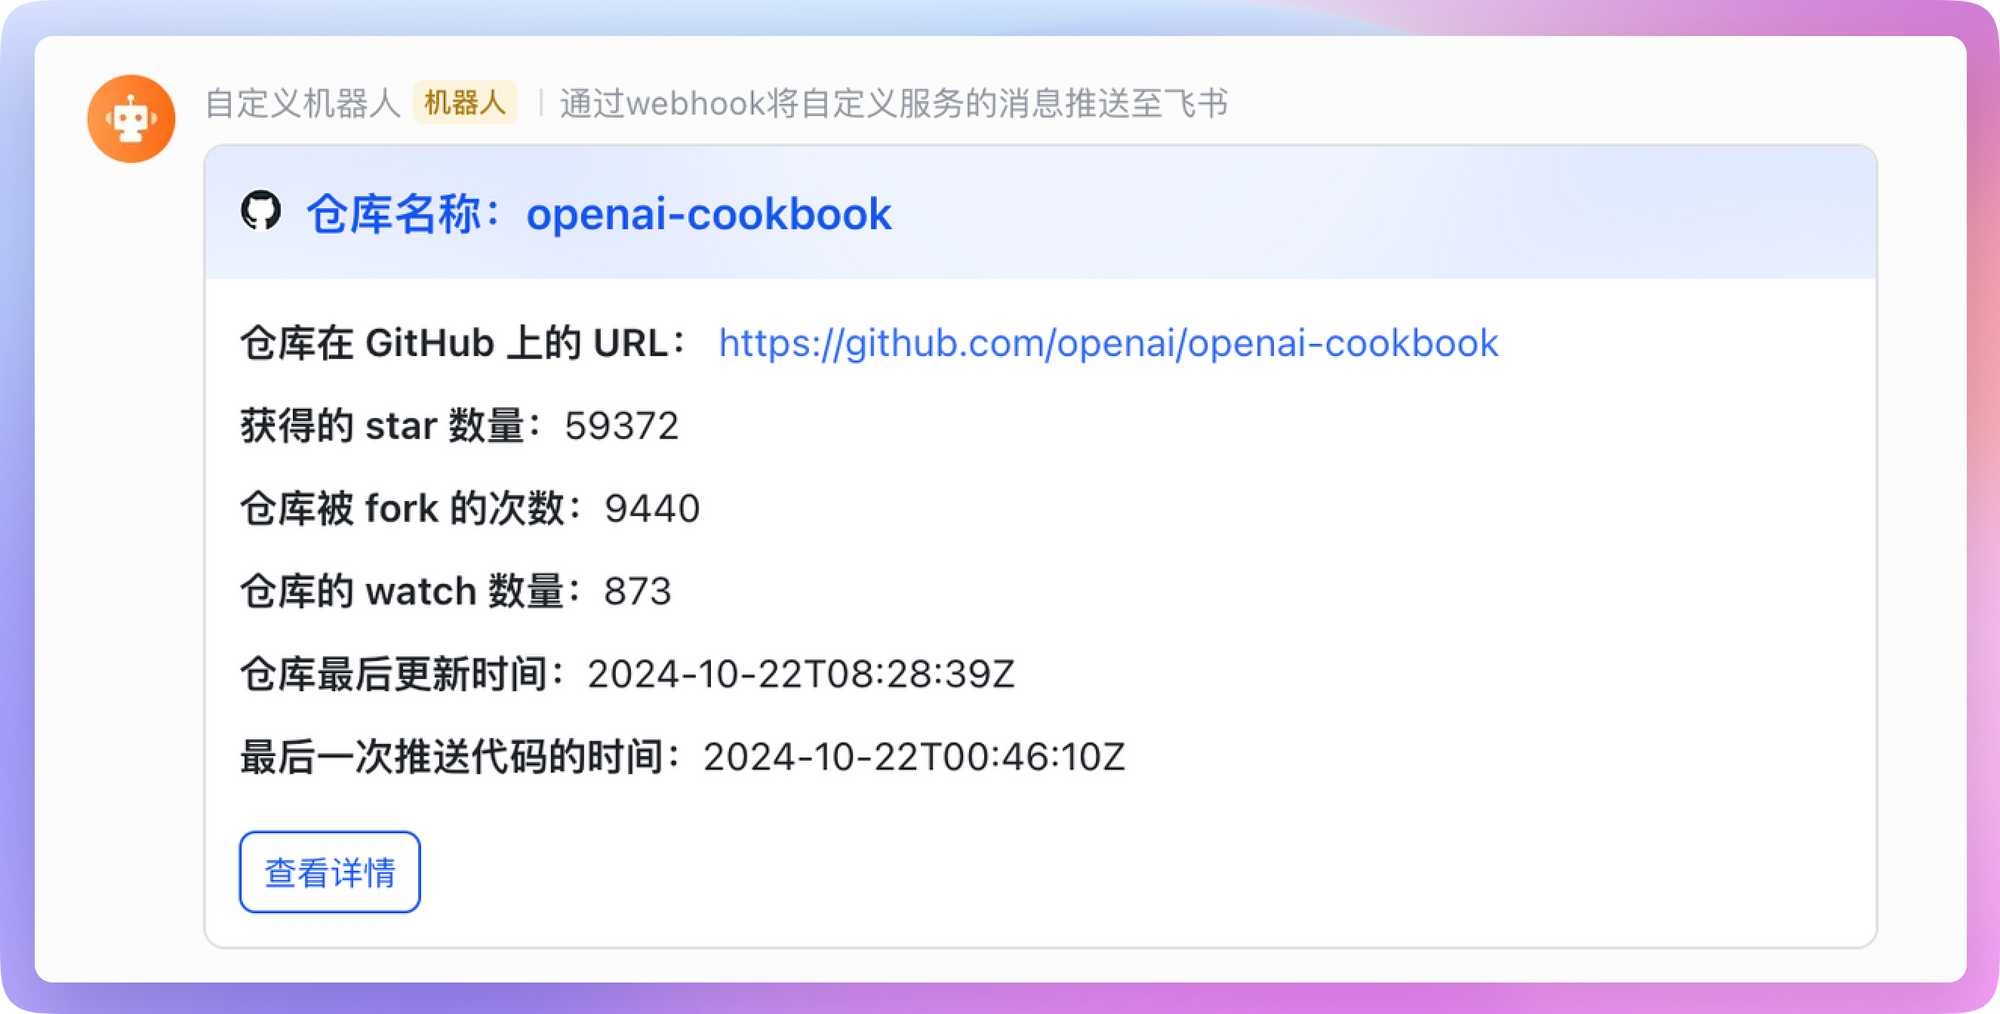
For example, if I want to send processed data to Feishu (Lark), I can add a new test step in the test scenario and use the Webhook API provided by Feishu to send messages. During this process, you can read the execution results of previous steps through "Dynamic Values", making data processing more convenient.
If you need to iterate over a group of data, or let returned fields meet certain specific conditions before continuing execution, you can also add "Flow Control Conditions" to test steps.
After the test scenario orchestration is complete, you can run the test to see the effect. Check whether there are errors in the entire test scenario and confirm whether the data is successfully transmitted back. If there are no problems with the orchestrated test scenario, you can proceed to the next step - setting up scheduled tasks!
Set Scheduled Tasks
In Apidog, setting up scheduled tasks is super simple. However, the prerequisite for using scheduled tasks is that you have already deployed a Runner on the server. You can refer to the detailed guide on Runner installation and configuration process.
Assuming you have already deployed the Runner, you can now add scheduled tasks to the previously orchestrated test scenarios to make them execute on schedule, achieving automated monitoring.
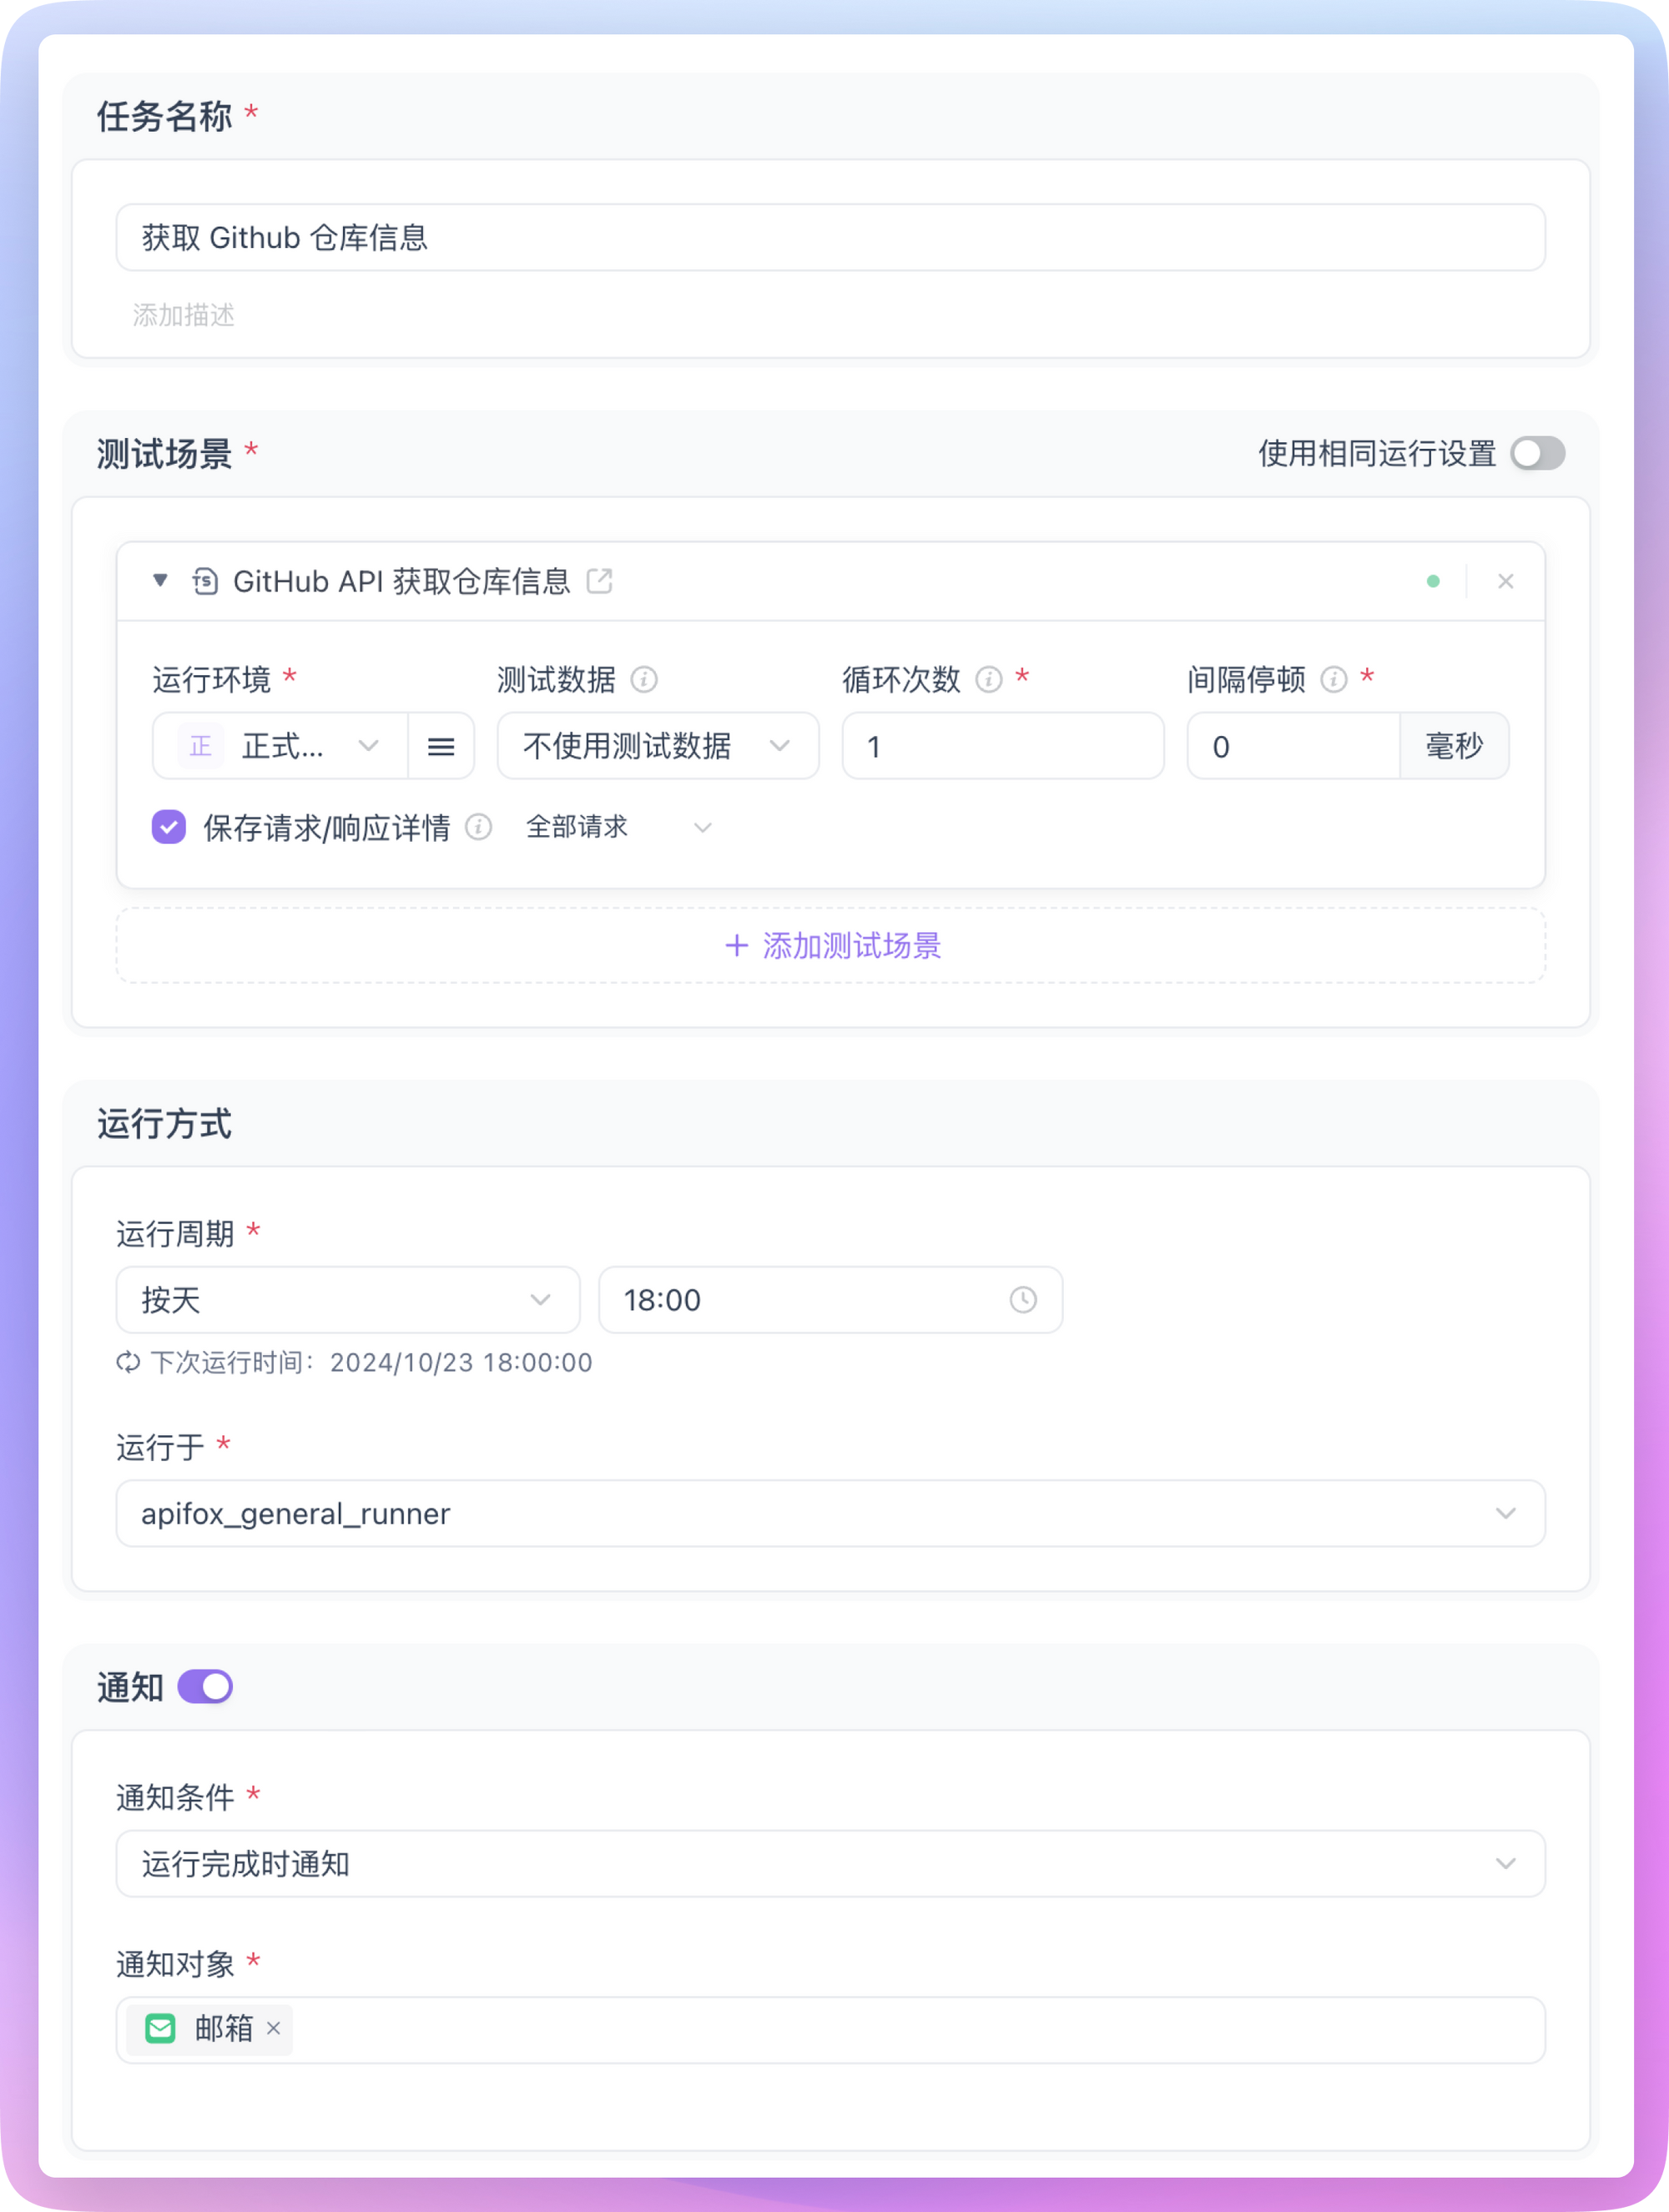
In Apidog's automated testing, find the "Scheduled Tasks" module, then create a new scheduled task. In the configuration interface, you will see the following options:
- Task Name: Give the task a descriptive name, such as "Daily GitHub Star Count Monitoring"
- Test Scenario: Select the test scenario that needs to run regularly, such as scheduled monitoring or crawler test scenarios
- Set Execution Cycle: For example, run once every day at 6:00 PM
- Execution Environment: Select the deployed Runner service
- Notification Settings: Specify the notification method after task completion, which can be email, DingTalk, etc.
After setting and saving, the test scenarios under this scheduled task will run regularly according to the set execution cycle, and we have achieved the goal of automated scheduled monitoring.
Extensions
In the "Get API" section above, besides finding APIs on official open platforms, you can also directly capture packets in the browser.
Here's an example:
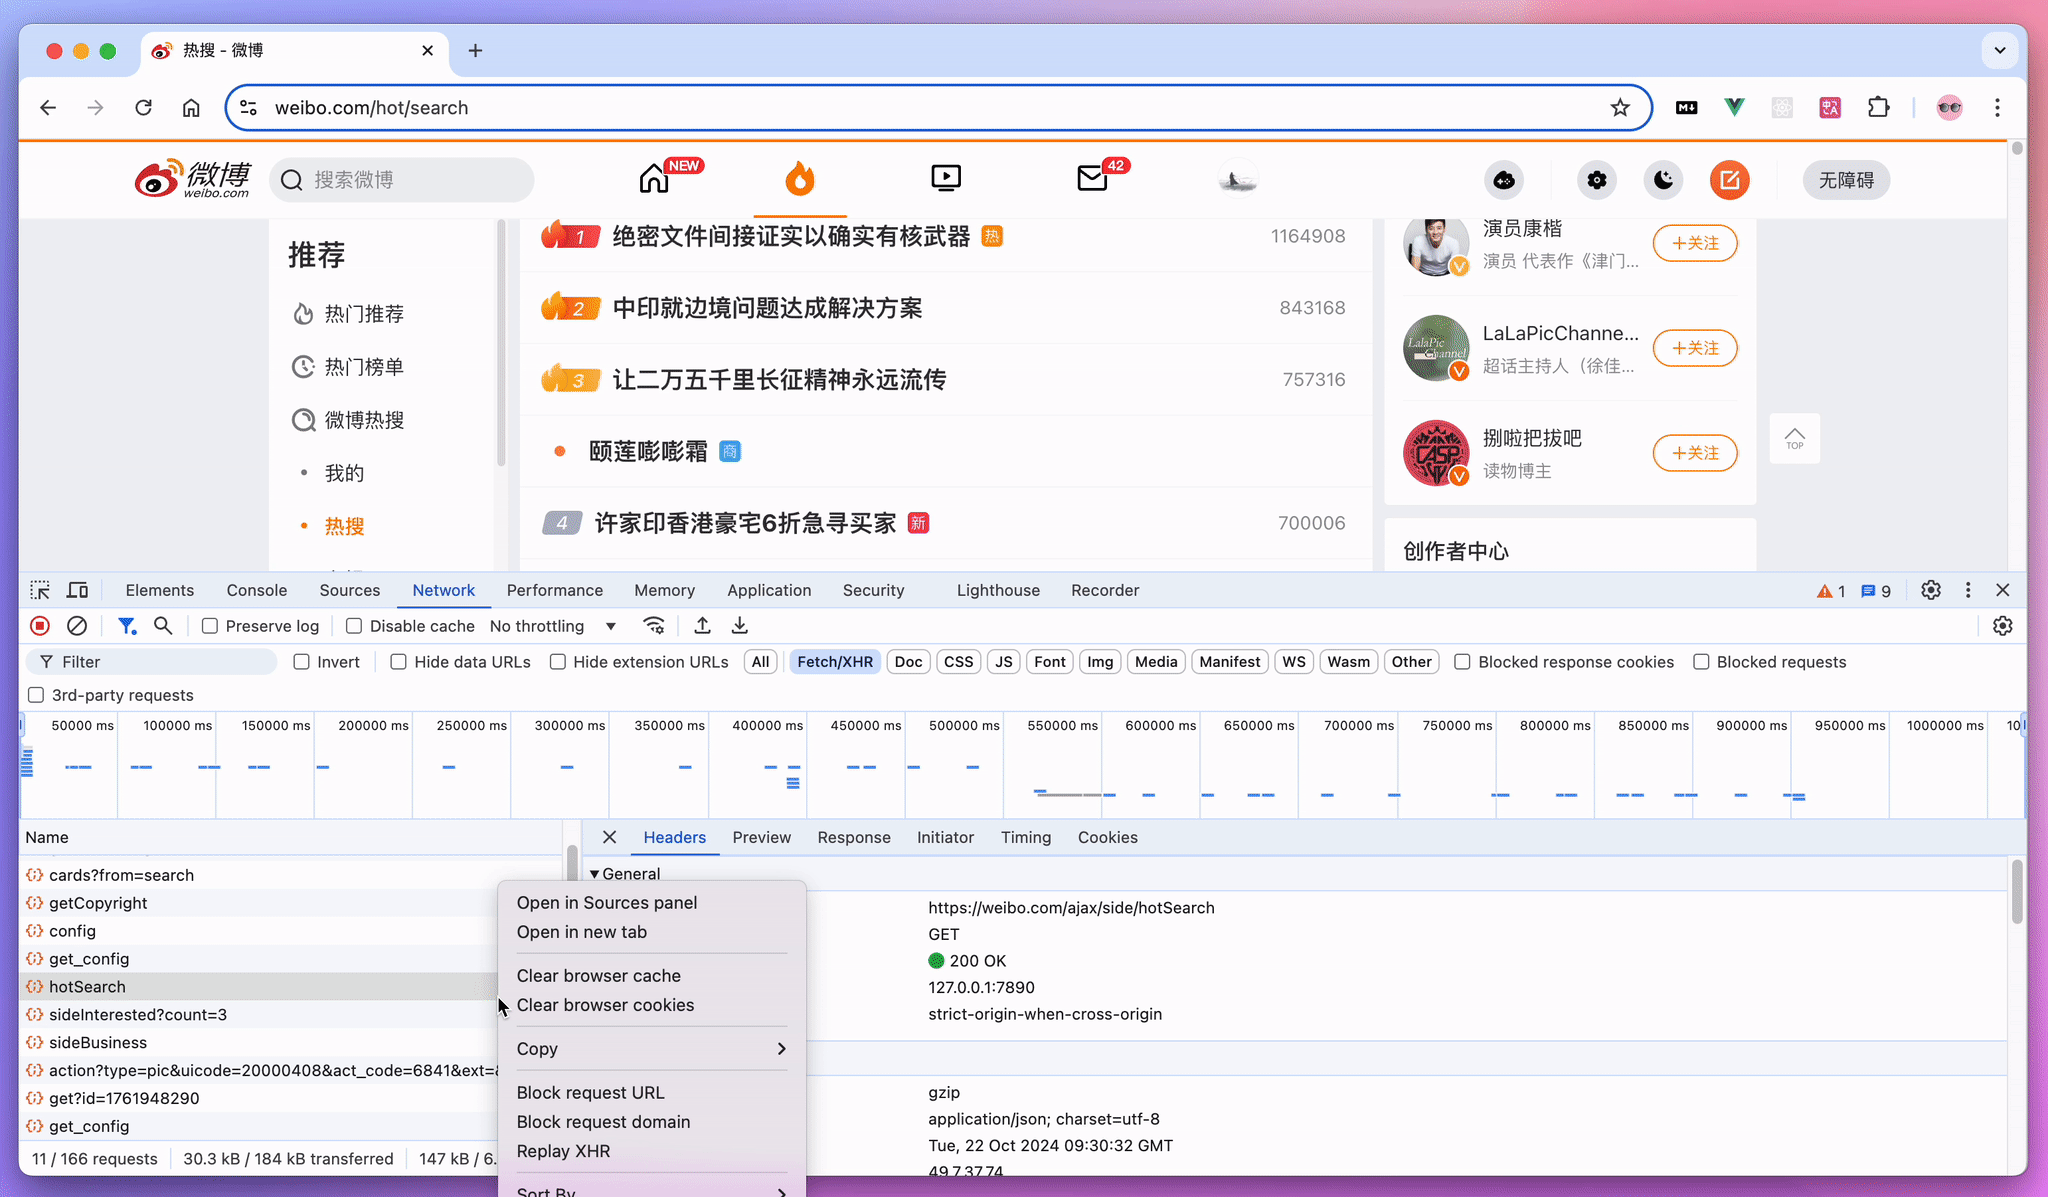
Suppose we want to monitor Weibo trending topics. We can open the Weibo trending page in the browser, then press F12 or Ctrl + Shift + I to open developer tools, and switch to the Network tab. Refresh the page, and you'll see a bunch of requests. Find the request that gets trending data, right-click and copy as cURL. Then, open Apidog, create a new interface, and paste the cURL you just copied into the input box. Apidog will automatically parse it for us - super convenient!
Besides packet capture, some third-party developers may have already reverse-engineered certain service APIs. You can search on GitHub and use them directly if needed.
Conclusion
This concludes the content of this article. I hope it can give you some inspiration to use Apidog's scheduled task feature to implement some interesting automated operations. If you have any cool ideas or practices, feel free to share them in the Apidog user community. Whether it's personal usage tips or ideas for solving difficult problems - everything is welcome!