Visual regression testing catches the bugs that traditional functional tests miss. A button can still be clickable but positioned off-screen. A CSS update might make text illegible. A layout change could break your responsive design on mobile devices. Visual Regression Testing compares screenshots of your application over time, automatically detecting any unintended visual changes before they reach your users.
This guide provides a practical walkthrough of visual regression testing techniques and a simplified implementation using Playwright, so you can start catching UI bugs immediately.
What is Visual Regression Testing?
Visual Regression Testing is an automated technique that captures screenshots of your application's UI and compares them against baseline images. When a new screenshot differs from the baseline—whether due to a layout shift, color change, font issue, or broken image—the test fails and highlights the differences.
Unlike traditional testing that validates functionality, Visual Regression Testing validates appearance and layout. It answers questions like:
- Does the checkout button still appear above the fold?
- Has the header height changed unexpectedly?
- Are images rendering at the correct aspect ratio?
- Does the mobile layout break after the CSS update?
Why Visual Regression Testing Matters
The importance of Visual Regression Testing becomes clear when you consider these scenarios:
- CSS Refactoring: You consolidate duplicate styles and suddenly the login form overlaps the footer on iPad screens.
- Third-Party Widgets: A marketing team adds a new analytics script that pushes your call-to-action button off-screen.
- Responsive Breakpoints: A seemingly harmless padding change breaks the mobile navigation menu.
- Cross-Browser Rendering: Firefox renders a flexbox differently than Chrome, causing layout shifts.
- API-Driven UI: Your backend API adds a new field that accidentally expands a table column, breaking the layout.
Without Visual Regression Testing, these bugs reach production and frustrate users. With it, you catch them during development when they’re cheap to fix.
Techniques for Visual Regression Testing
1. Manual Screenshot Comparison
The simplest approach: developers manually capture screenshots before and after changes and compare them visually.
Pros: No setup cost
Cons: Tedious, error-prone, doesn’t scale
2. DOM Comparison
Tools compare the DOM structure rather than pixel-perfect screenshots.
Pros: Less brittle to minor pixel differences
Cons: Misses CSS rendering issues
3. Pixel-by-Pixel Comparison
Tools capture full-page screenshots and compare every pixel.
Pros: Catches all visual changes
Cons: False positives from dynamic content (ads, timestamps)
4. Visual AI Comparison
Modern tools use AI to identify meaningful changes while ignoring noise.
Pros: Smart detection, fewer false positives
Cons: Requires configuration, some cost
| Technique | Accuracy | Maintenance | Best For |
|---|---|---|---|
| Manual | Low | High | One-off checks |
| DOM | Medium | Medium | Component testing |
| Pixel | High | Medium | Static pages |
| AI | High | Low | Dynamic applications |
Practical Guide: Visual Regression Testing with Playwright
Let’s build a simple project to demonstrate Visual Regression Testing in action using Playwright.
Step 1 — Create the Project
Initialize a Node.js project:
mkdir visual-regression-demo && cd visual-regression-demo
npm init -y
npm install --save-dev @playwright/test
npx playwright install
Create this structure:
project/
├── images/
│   ├── pic1.jpg
│   ├── pic2.jpg
│   ├── pic3.jpg
│   └── pic4.jpg
├── tests/
│   └── visual.spec.js
├── index.html
└── package.json
Add to package.json:
{
  "scripts": {
    "test": "playwright test",
    "test:update": "playwright test --update-snapshots"
  }
}
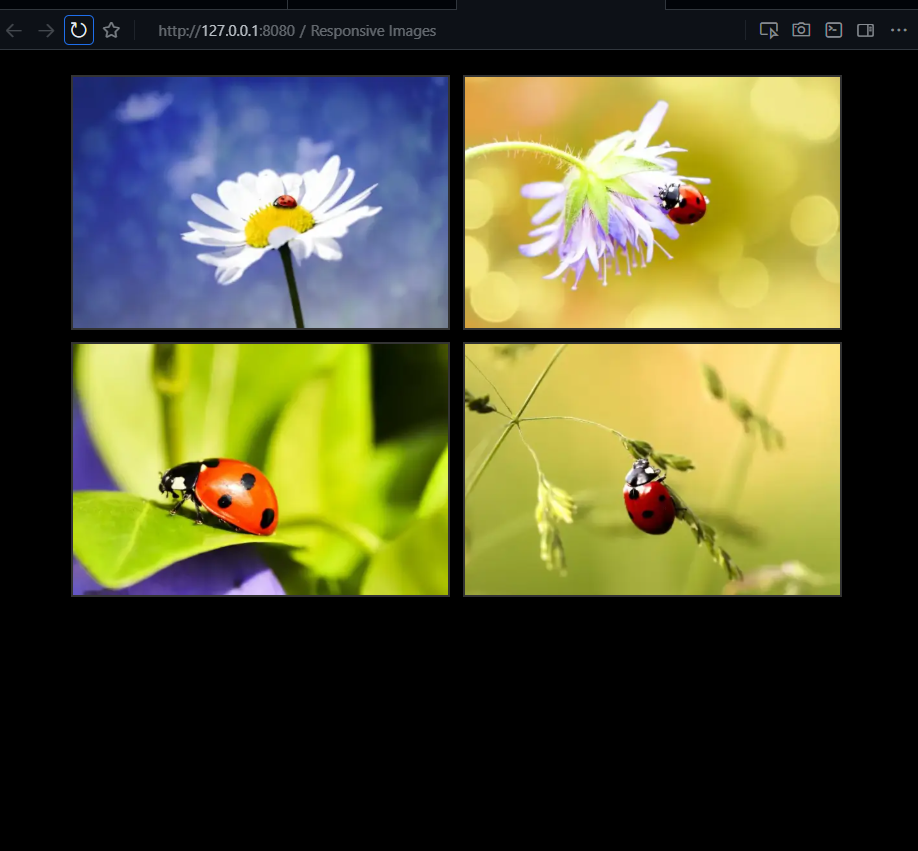
Step 2 — Create a Simple HTML Page
Create index.html:
<!DOCTYPE html>
<html lang="en">
<head>
  <meta charset="UTF-8">
  <meta name="viewport" content="width=device-width, initial-scale=1.0">
  <title>Visual Regression Demo</title>
  <style>
    .gallery { display: flex; flex-wrap: wrap; gap: 10px; }
    .gallery img { width: 200px; height: 200px; object-fit: cover; }
  </style>
</head>
<body>
  <h1>Product Gallery</h1>
  <div class="gallery">
    <img src="images/pic1.jpg" alt="Product 1">
    <img src="images/pic2.jpg" alt="Product 2">
    <img src="images/pic3.jpg" alt="Product 3">
    <img src="images/pic4.jpg" alt="Product 4">
  </div>
</body>
</html>
Serve the page: python -m http.server 8000 or use Node.js static server.
Step 3 — Write the Playwright Visual Test
Create tests/visual.spec.js:
const { test, expect } = require('@playwright/test');

test.describe('Visual Regression Tests', () => {
  test.beforeEach(async ({ page }) => {
    await page.goto('http://localhost:8000');
  });

  test('homepage matches baseline', async ({ page }) => {
    // Take full-page screenshot
    await expect(page).toHaveScreenshot('homepage.png', {
      fullPage: true,
      threshold: 0.2, // Allow minor differences
    });
  });

  test('gallery layout is responsive', async ({ page }) => {
    // Test mobile viewport
    await page.setViewportSize({ width: 375, height: 667 });
    await expect(page).toHaveScreenshot('mobile-homepage.png');
  });
});
Step 4 — Run and Create Baseline Snapshots
First run (creates baselines):
npm run test:update
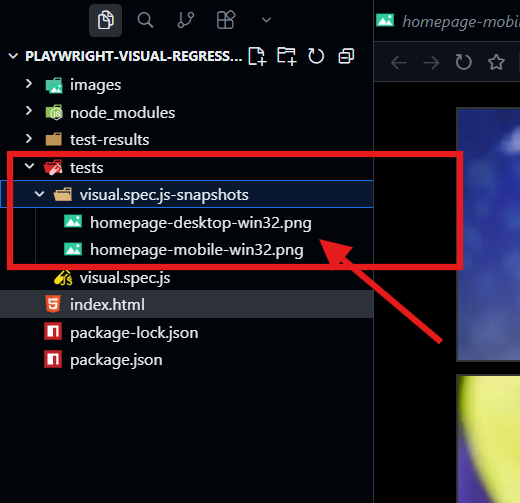
This generates homepage.png and mobile-homepage.png in a __snapshots__ folder.
Step 5 — Run Tests Successfully
Now run tests normally:
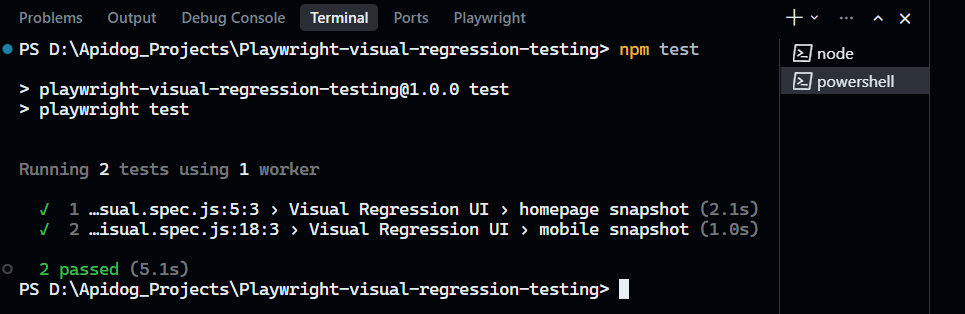
npm test
You should see: 2 passed ✅
Step 6 — Force a Visual Failure
Break the layout by editing index.html and duplicate the occurrence of one image:
<img src="images/img3.webp" alt="Image 3">
<img src="images/img3.webp" alt="Image 4">
Now, the test html page should have a duplicate image.
Run tests again:
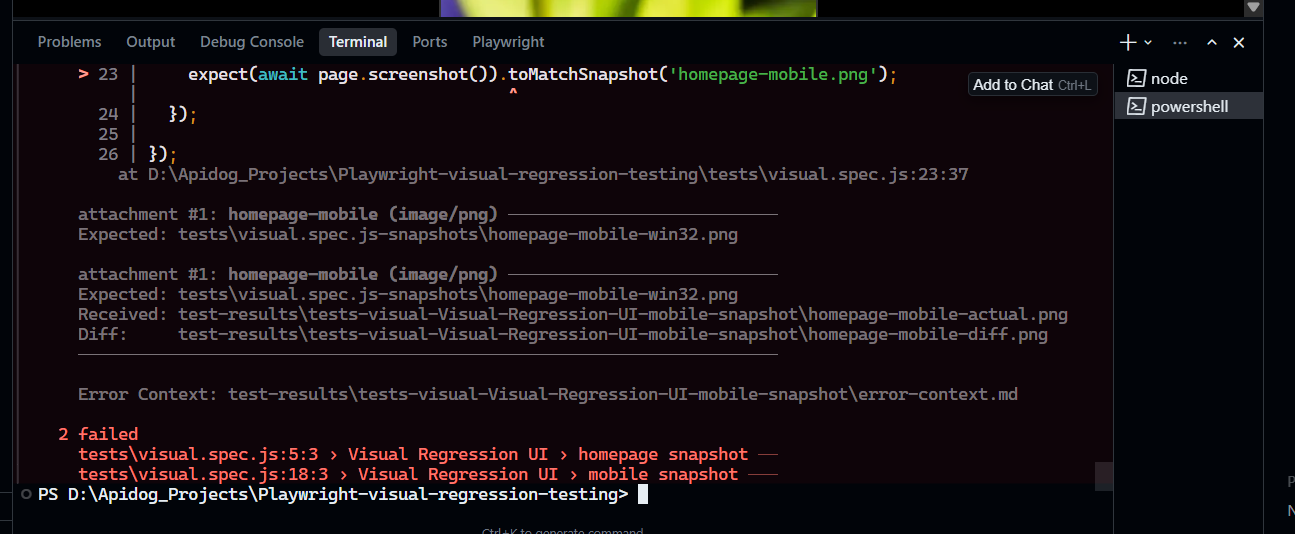
npm test
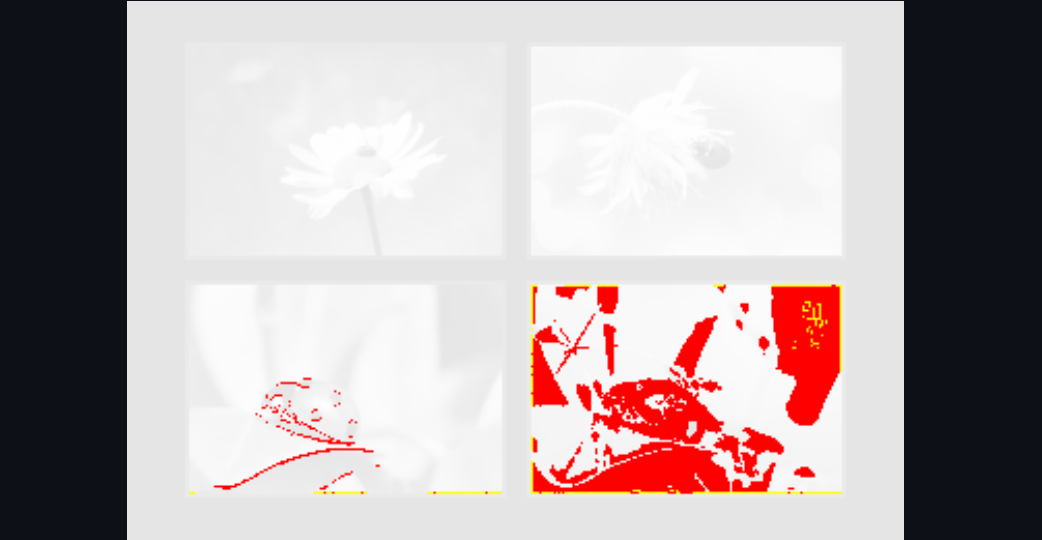
You’ll see: 2 failed with diff images showing the layout change.
You can view the changes in detail by browsing through the "test-results" folder.
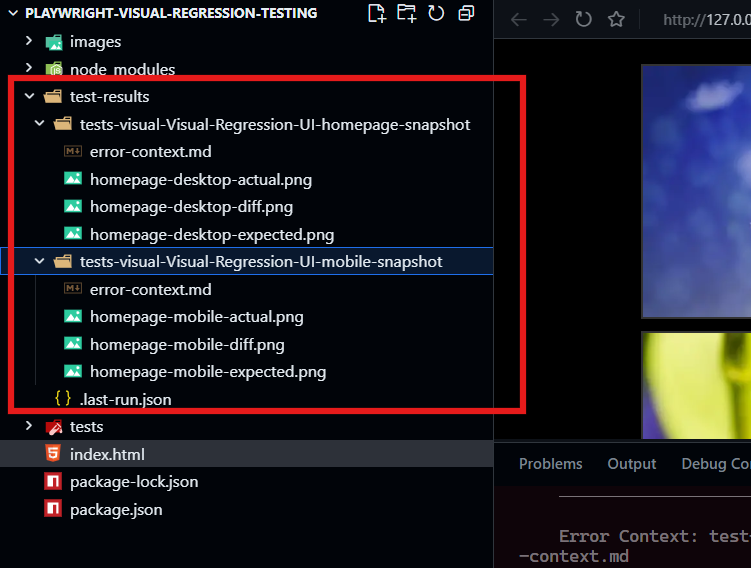
The area highlighted in red shows the area that has been changed. The test results should look as follows:
After completion, you can revert the change, or update snapshots using the command below if the changes you made were intentional:
npm run test:update
How Apidog Helps with API-Driven Visual Testing
Visual Regression Testing often fails when the root cause is an API problem. If your backend returns malformed data or incorrect image URLs, the UI will break visually. Apidog ensures your APIs deliver the right data for rendering.
Testing API Responses That Affect UI
# Apidog test for product gallery API
Test: GET /api/products
When: Request sent with category "featured"
Oracle 1: Response contains 4 products
Oracle 2: Each product has valid image URL (200 status)
Oracle 3: Image URLs use CDN domain
Oracle 4: No broken image links in response
Validating API Schema for UI Components
// Apidog schema validation prevents UI breaks
Test: Product API Schema
Oracle: Response matches ProductCard schema
  - id: string (required)
  - name: string (max 50 chars)
  - image_url: URL format
  - price: number (positive)
If the API returns a price as a string instead of number, your UI might fail to render the price correctly. Apidog catches this before it breaks the visual layout.
Monitoring API Performance Impact on UI
Test: GET /api/products - Performance
When: Request with 4 products
Oracle 1: Response time < 500ms
Oracle 2: Image CDN responds in < 200ms each
Slow APIs cause images to load late, creating visual jumping. Apidog ensures APIs meet performance budgets that keep your UI snappy.
API Contract Testing Prevents Visual Regressions
When your API contract changes (new field, removed field), Apidog flags it:
// Apidog contract test
Test: Product API Version 2
Oracle: New field "badge" is optional, not breaking for UI
This prevents "undefined" text from appearing in your UI when the API adds a field your frontend doesn't handle yet.
Best Practices for Visual Regression Testing
- Stable Test Environment: Use consistent data and disable animations
- Threshold Tuning: Set pixel difference thresholds (0.1-0.3) to avoid false positives
- Targeted Testing: Test critical pages (homepage, checkout) before testing everything
- Responsive Coverage: Test mobile, tablet, and desktop viewports
- Mask Dynamic Content: Hide timestamps, ads, and random content from screenshots
- Update Baselines Intentionally: Review diffs before updating snapshots
- Run in CI/CD: Integrate visual tests into your pipeline with tools like Apidog
Frequently Asked Questions
Q1: Can visual regression testing replace functional testing?
Ans: No. Visual Regression Testing complements functional tests. It catches layout issues, but functional tests validate behavior and API correctness. Use both.
Q2: How do I handle dynamic content like timestamps?
Ans: Use Playwright’s mask option or replace dynamic content with static values before screenshotting. Apidog can also validate that APIs return consistent data for tests.
Q3: Are visual tests flaky?
Ans: Can be, if you don’t control the environment. Disable animations, use consistent data, and set appropriate thresholds. Apidog helps by ensuring APIs return predictable data.
Q4: Should I test every page visually?
Ans: Focus on critical user paths first. Testing everything creates maintenance overhead. Prioritize high-traffic pages and components.
Q5: How does Apidog help if my visual bug is CSS-related?
Ans: Many visual bugs stem from API data changes (missing fields, wrong types). Apidog validates API schemas and responses, preventing data-related visual breaks before they hit your UI.
Conclusion
Visual Regression Testing is your safety net against the unintended consequences of code changes. While functional tests confirm buttons still work, visual tests ensure those buttons still appear where users expect them. This distinction is critical for user experience and brand consistency.
The Playwright example demonstrates how accessible visual testing has become. With just a few lines of code, you can capture and compare screenshots across viewports, catching layout breaks before production. The key is starting small, stabilizing your test environment, and running tests continuously.
Modern applications are increasingly API-driven, which means visual bugs often start with data problems. Apidog completes the picture by ensuring your APIs deliver consistent, correctly-formatted data that your UI can render reliably. When APIs and visual tests work together, you get complete coverage—functionality, performance, and appearance—all validated automatically.
Start by adding visual tests to your most critical user flows today. The first time a test catches a layout break that would have embarrassed you in production, you’ll wonder how you ever shipped software without it.


