
Spring Boot is a powerful framework that simplifies the development of Java applications. One of its standout features is the Spring Boot Actuator, a sub-project designed to provide production-ready features to help you monitor and manage your application. In this blog post, we'll dive deep into Spring Boot Actuator endpoints, understanding their significance, and how to make the most of them in your applications.
Ready to take your application monitoring to the next level? Download Apidog for FREE and start integrating it with your Spring Boot Actuator endpoints today. With Apidog, you can easily design, test, and monitor your APIs, ensuring optimal performance and reliability.
What Are Spring Boot Actuator Endpoints?
First, let's clear up what Spring Boot Actuator endpoints are. Actuator endpoints are specific URLs provided by the Spring Boot Actuator to monitor and interact with your application. These endpoints expose various application information such as health, metrics, environment properties, and more.
Spring Boot Actuator comes with a wide array of built-in endpoints, and you can also create custom ones. These endpoints are extremely useful for gaining insights into your application's running state and for performing management tasks.
Why Use Spring Boot Actuator Endpoints?
Why should you care about Spring Boot Actuator endpoints? Well, they offer several benefits:
- Monitoring: You can monitor your application's performance and health in real-time.
- Troubleshooting: Actuator endpoints help in diagnosing issues by providing detailed information about the application's internal state.
- Automation: These endpoints can be integrated with monitoring tools like Prometheus, Grafana, or Apidog for automated health checks and alerts.
- Ease of Use: They are easy to set up and require minimal configuration to get started.
With these benefits in mind, let's explore some of the key Spring Boot Actuator endpoints and how to use them effectively.
Getting Started with Spring Boot Actuator
Before we delve into specific endpoints, we need to set up Spring Boot Actuator in our application. Here’s a quick guide to get you started:
Add the Dependency: Include the Spring Boot Actuator dependency in your pom.xml file:
<dependency>
    <groupId>org.springframework.boot</groupId>
    <artifactId>spring-boot-starter-actuator</artifactId>
</dependency>
Configuration: By default, Actuator endpoints are exposed on the /actuator base path. You can customize this in your application.properties or application.yml file:
management.endpoints.web.base-path=/manage
Security: For production environments, securing your Actuator endpoints is crucial. You can configure security settings to restrict access:
management.endpoints.web.exposure.include=health,info
management.endpoint.health.probes.enabled=true
management.endpoint.health.show-details=always
management.endpoints.web.exposure.exclude=env
With the setup out of the way, let's move on to exploring the most commonly used Spring Boot Actuator endpoints.

Key Spring Boot Actuator Endpoints
1. Health Endpoint
The /health endpoint provides basic health information about your application. It’s one of the most commonly used endpoints for monitoring purposes.
- URL:
/actuator/health - Response: JSON object indicating the health status (
UP,DOWN, etc.)
Example response:
{
    "status": "UP",
    "components": {
        "db": {
            "status": "UP",
            "details": {
                "database": "MySQL",
                "validationQuery": "isValid()"
            }
        },
        "diskSpace": {
            "status": "UP",
            "details": {
                "total": 499963174912,
                "free": 340105166848,
                "threshold": 10485760
            }
        }
    }
}
2. Info Endpoint
The /info endpoint exposes arbitrary application information. You can use this endpoint to provide details such as version, description, and other metadata.
- URL:
/actuator/info - Configuration: You can configure the information in the
application.propertiesfile:
info.app.name=My Spring Boot Application
info.app.description=This is a sample application.
info.app.version=1.0.0
3. Metrics Endpoint
The /metrics endpoint provides a wealth of information about various metrics collected by the application, such as memory usage, CPU usage, and HTTP request statistics.
- URL:
/actuator/metrics - Response: JSON object with metrics data
Example response:
{
    "names": [
        "jvm.memory.used",
        "jvm.gc.pause",
        "http.server.requests",
        ...
    ]
}
You can also query specific metrics, for example, to get HTTP request statistics:
- URL:
/actuator/metrics/http.server.requests - Response: Detailed metrics data for HTTP requests
4. Env Endpoint
The /env endpoint exposes properties from the Spring Environment. This can be very useful for debugging configuration issues.
- URL:
/actuator/env - Response: JSON object with environment properties
Example response:
{
    "activeProfiles": ["dev"],
    "propertySources": [
        {
            "name": "applicationConfig: [classpath:/application.properties]",
            "properties": {
                "server.port": {
                    "value": "8080"
                }
            }
        },
        ...
    ]
}
5. Beans Endpoint
The /beans endpoint provides a list of all Spring beans in the application context along with their dependencies. This is useful for understanding the wiring of your application.
- URL:
/actuator/beans - Response: JSON object with beans data
Example response:
{
    "contexts": {
        "application": {
            "beans": {
                "beanName": {
                    "aliases": [],
                    "scope": "singleton",
                    "type": "com.example.MyBean",
                    "resource": "file:./classes/com/example/MyBean.class",
                    "dependencies": []
                },
                ...
            }
        }
    }
}
Integrating Spring Boot Actuator Endpoints with Apidog
Spring Boot Actuator endpoints offer a rich set of tools for monitoring and managing your application. To take full advantage of these features, integrating them with a powerful API management tool like Apidog can be incredibly beneficial. Apidog helps in designing, testing, and monitoring APIs seamlessly, enhancing your overall application management strategy.
Why Integrate with Apidog?
Apidog provides several advantages when integrated with Spring Boot Actuator endpoints:
- Centralized Monitoring: Aggregate all your Actuator endpoint data in one place.
- Automated Alerts: Set up automated alerts for critical metrics and health statuses.
- Enhanced Analytics: Leverage Apidog's analytics features for in-depth analysis of metrics.
- API Documentation: Generate comprehensive API documentation effortlessly.
Steps to Integrate Spring Boot Actuator with Apidog
Register Your API: Start by registering your Spring Boot API with Apidog.
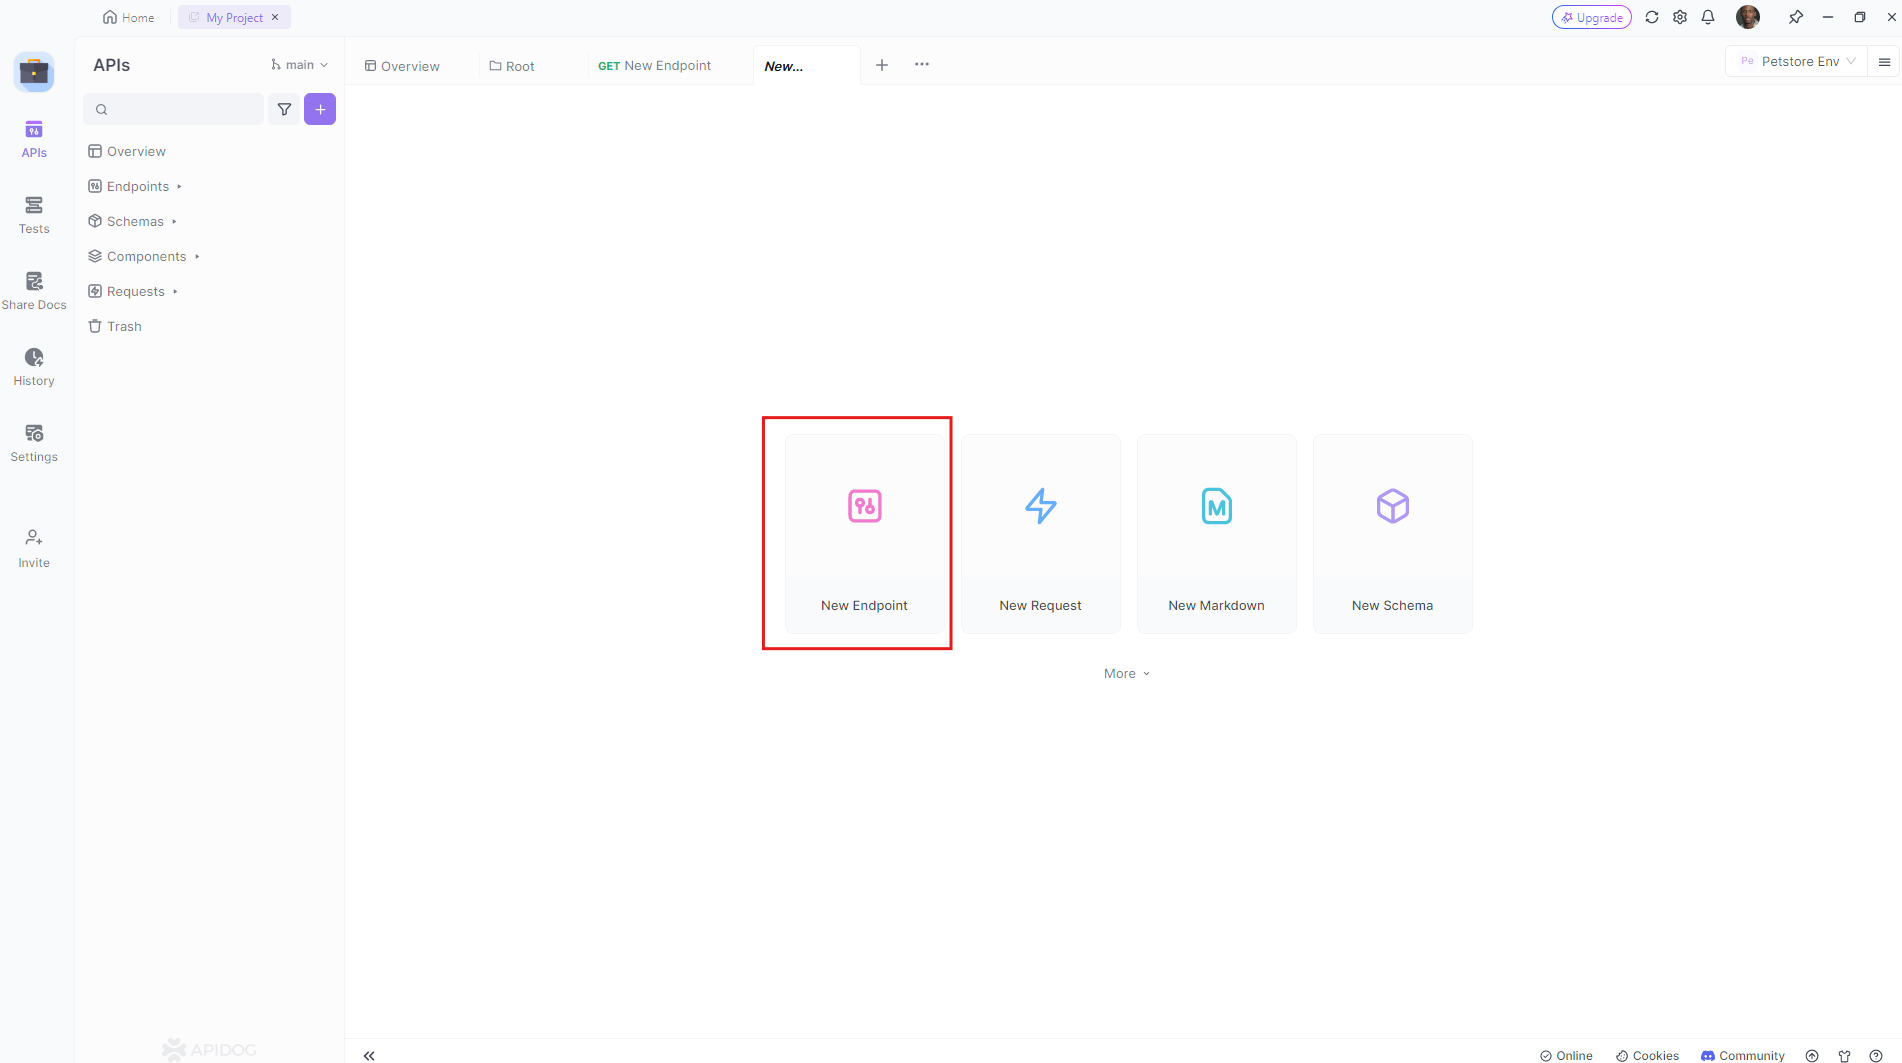
This will allow Apidog to recognize and interact with your Actuator endpoints.
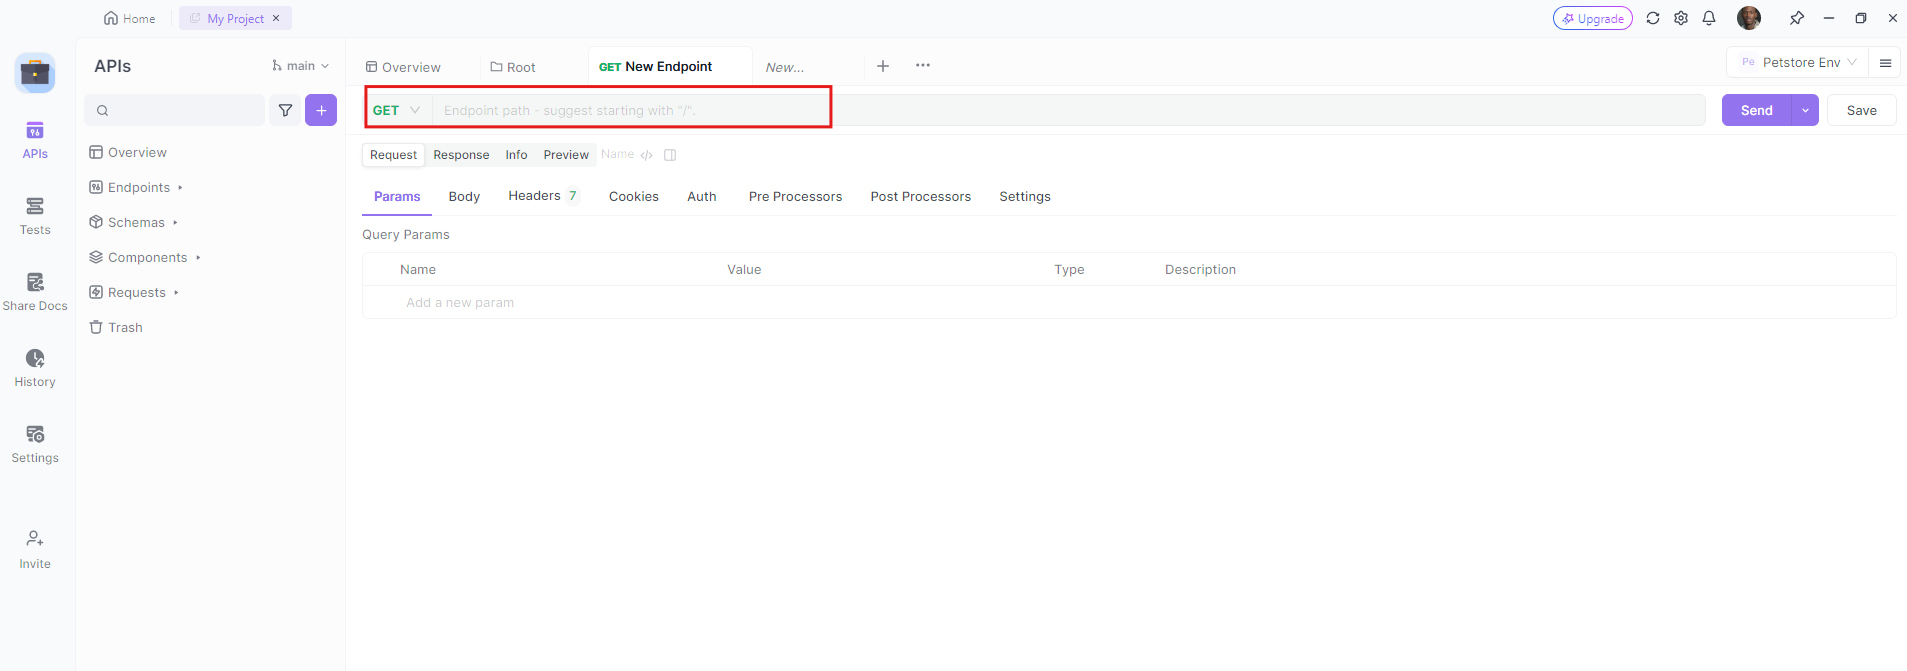
Ensure that your Actuator endpoints are exposed and accessible. Adjust your security settings if necessary to allow Apidog to access these endpoints.
Monitor Health: Use Apidog to continuously monitor the endpoint. This will keep track of your application's health status and notify you of any issues.
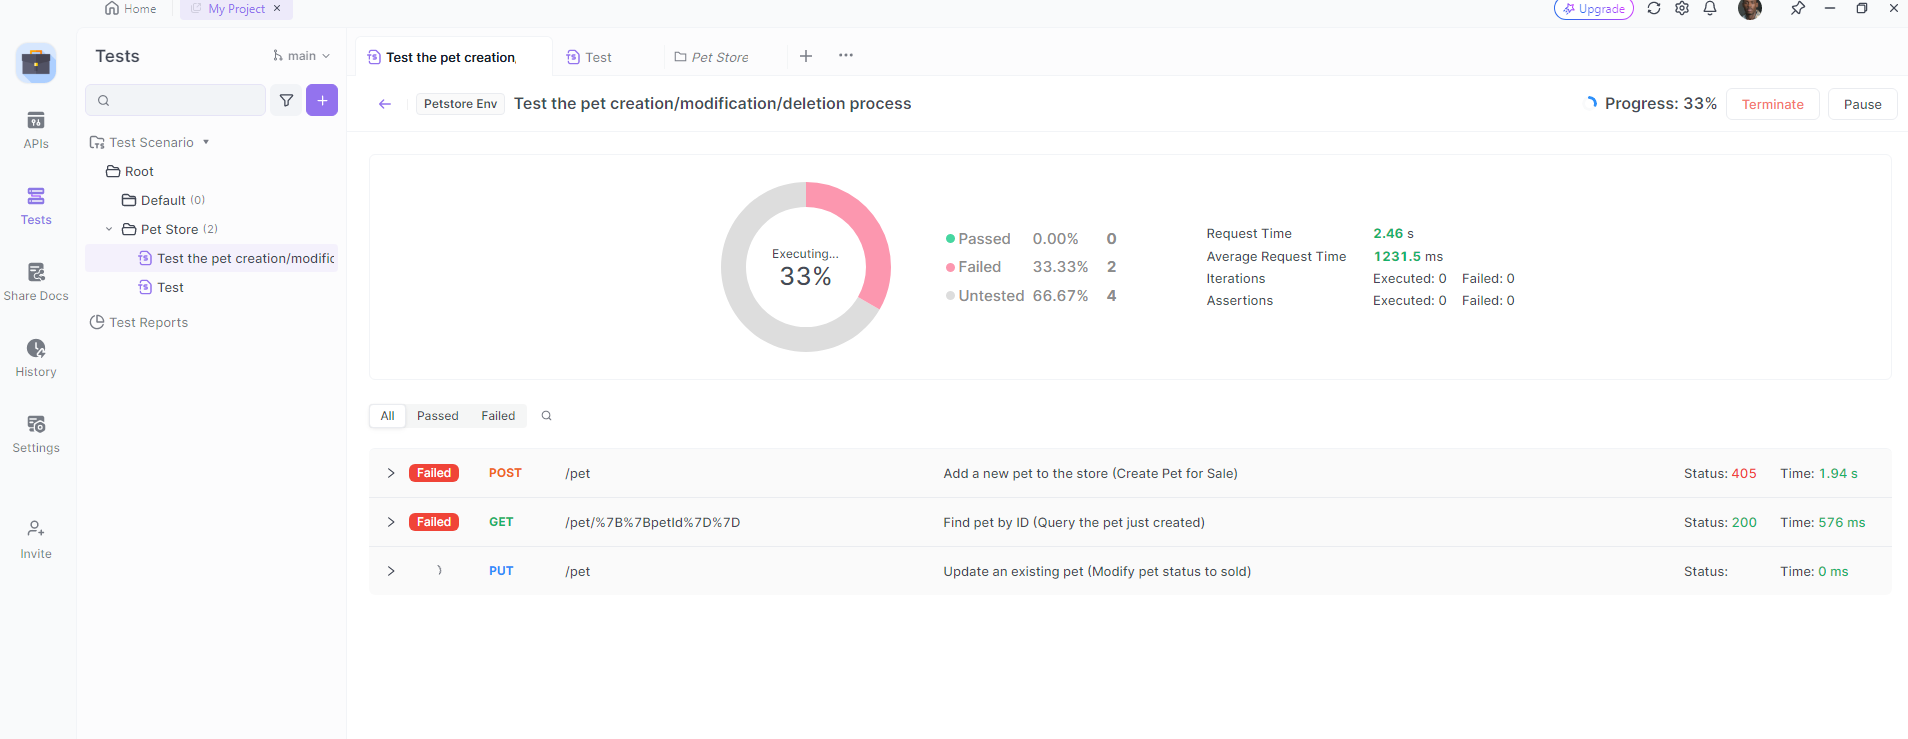
Utilize Apidog's analytics capabilities to gather insights from the endpoint. This helps you understand performance trends and identify potential bottlenecks.
Benefits of Integration
Integrating Spring Boot Actuator endpoints with Apidog provides a robust monitoring solution. Here are some key benefits:
- Real-Time Monitoring: Get real-time updates on the health and performance of your application.
- Proactive Issue Resolution: Automated alerts enable you to address issues before they impact users.
- Comprehensive Analytics: Detailed analytics help you understand usage patterns and optimize resource allocation.
- Simplified Management: Centralized API management makes it easier to monitor and manage multiple services.
This integration opens up a world of possibilities for proactive application management. Start integrating today and experience the benefits of seamless monitoring and management with Spring Boot Actuator and Apidog.
Advanced Tips and Tricks for Using Spring Boot Actuator Endpoints
Now that we have a solid understanding of the basics, let’s delve into some advanced tips and tricks that can help you get even more out of Spring Boot Actuator endpoints.
Fine-Tuning Metrics Collection
By default, Spring Boot Actuator collects a plethora of metrics. However, in a production environment, you might want to customize which metrics are collected to optimize performance and storage.
Enable Specific Metrics: You can fine-tune which metrics are enabled using properties in application.properties or application.yml.
management.metrics.enable.jvm=true
management.metrics.enable.process=true
management.metrics.enable.http.server.requests=true
Sampling and Histogram: Adjust the sampling rate and histogram configuration to manage the granularity and performance of metrics collection.
management.metrics.distribution.percentiles.http.server.requests=0.5,0.95,0.99
management.metrics.distribution.expiry=http.server.requests=60s
Creating Composite Health Indicators
Composite health indicators aggregate multiple health indicators into a single health status. This can be particularly useful if you have several subsystems to monitor.
Create Health Indicators: Implement custom health indicators by extending AbstractHealthIndicator.
import org.springframework.boot.actuate.health.Health;
import org.springframework.boot.actuate.health.HealthIndicator;
import org.springframework.stereotype.Component;

@Component
public class CustomHealthIndicator implements HealthIndicator {

    @Override
    public Health health() {
        // Custom health check logic
        return Health.up().withDetail("custom", "All systems go").build();
    }
}
Aggregate Health Indicators: Use HealthAggregator to combine multiple health indicators.
import org.springframework.boot.actuate.health.CompositeHealthContributor;
import org.springframework.boot.actuate.health.HealthContributor;
import org.springframework.context.annotation.Bean;
import org.springframework.context.annotation.Configuration;

@Configuration
public class HealthConfig {

    @Bean
    public HealthContributor customHealthContributor() {
        return CompositeHealthContributor.fromMap(Map.of(
            "custom", new CustomHealthIndicator(),
            "db", new DataSourceHealthIndicator(dataSource)
        ));
    }
}
Customizing Endpoint Paths and Exposure
You might want to change the default paths or control which endpoints are exposed based on different environments (e.g., dev vs. prod).
Custom Path: Change the base path for all actuator endpoints.
management.endpoints.web.base-path=/monitoring
Environment-Specific Exposure: Use profiles to customize endpoint exposure for different environments.
# application-dev.properties
management.endpoints.web.exposure.include=*

# application-prod.properties
management.endpoints.web.exposure.include=health,info,metrics
Leveraging Third-Party Monitoring Tools
While Spring Boot Actuator provides a solid foundation, integrating with third-party tools can offer more robust monitoring capabilities. Tools like Prometheus, Grafana, and New Relic can ingest metrics from Actuator endpoints and provide advanced analytics, alerting, and visualization.
Prometheus: Configure a Prometheus endpoint to scrape metrics.
management.endpoint.prometheus.enabled=true
Grafana: Use Grafana to visualize Prometheus metrics by adding a data source pointing to your Prometheus server.
Debugging and Logging
Enhanced logging around Actuator endpoints can aid in debugging issues. Customize logging levels for Actuator endpoints in application.properties.
logging.level.org.springframework.boot.actuate=DEBUG
logging.level.org.springframework.boot.actuate.endpoint=TRACE
Automation with CI/CD
Incorporate Actuator endpoints into your CI/CD pipelines to automate health checks and deployment validations.
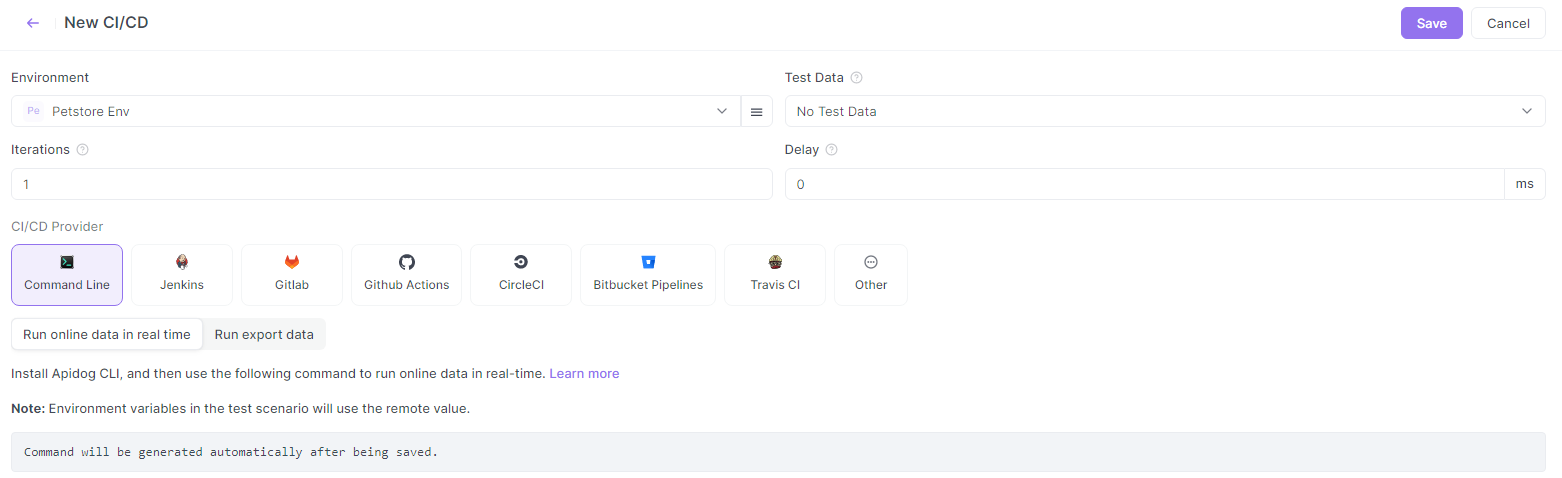
CI/CD is available on Apidog
Pre-Deployment Checks: Before deploying, trigger a script that checks the health endpoint.
curl -f http://localhost:8080/actuator/health || exit 1
Post-Deployment Monitoring: After deployment, continuously monitor key metrics and set up alerts for anomalies.
Conclusion
Spring Boot Actuator endpoints are not just a tool for monitoring; they are a comprehensive solution for maintaining the health, performance, and reliability of your application. By leveraging the power of these endpoints, you can gain deep insights into your application's inner workings, automate management tasks, and ensure that your system remains robust and responsive under various conditions.
Whether you’re just starting with Spring Boot or you’re looking to refine your monitoring strategy, the Actuator endpoints provide a solid foundation. Coupled with tools like Apidog, you can elevate your monitoring capabilities to new heights, ensuring your applications are always running smoothly and efficiently.
Remember, while the defaults work great out of the box, the real power lies in customizing and integrating these endpoints into your specific workflow. So, start exploring, tweaking, and integrating Actuator endpoints today and watch as your application monitoring transforms from basic to brilliant.


