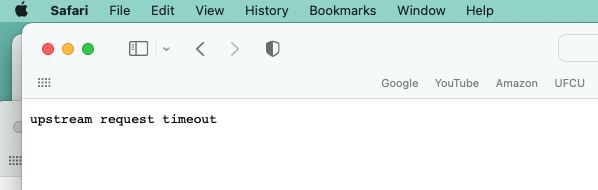
Picture this: you've just deployed a beautiful new feature. Your code is clean, your tests are passing, and you're feeling like a coding wizard. You lean back in your chair, take a sip of your coffee, and decide to give it a real-world test. You click the button, the loading spinner appears, and then... nothing. The spinner just spins. After what feels like an eternity, you're greeted with a stark, unfriendly error message in your browser: "504 Gateway Timeout" or, even more cryptically, in your logs: "upstream request timeout". If you’ve spent any time working with APIs, reverse proxies, or microservices, chances are you’ve run into the dreaded error message.
Frustrating, right? It usually appears when your client is trying to send or receive data from a server, but the request just takes too long. Instead of patiently waiting forever, the server times out and throws this error. Your heart sinks. That feeling of triumph instantly evaporates, replaced by the familiar dread of debugging a production issue. What went wrong? Your application is running, the database is online, so what gives?
If you're tired of playing detective with timeouts and want a tool that gives you crystal-clear visibility into your API requests and responses, you need to check out Apidog.
Now, let's pull back the curtain and demystify this common but frustrating error. In this deep dive, we're going to chat about what an "upstream request timeout" actually means, why it happens, and most importantly, how you can find it, fix it, and prevent it from ruining your day.
Want an integrated, All-in-One platform for your Developer Team to work together with maximum productivity?
Apidog delivers all your demands, and replaces Postman at a much more affordable price!
Let's Start with the Basics: What Does "Upstream Request Timeout" Mean?
Let’s break it down in simple terms.
When you see "upstream request timeout", it means:
- Your client or proxy server (like Nginx, API Gateway, or Load Balancer) tried to forward a request to an upstream server (the real backend service or API).
- But the upstream server took too long to respond.
- After a set threshold, the proxy gave up and returned a timeout error.
To understand the error, we first need to understand the metaphor. Think of data flowing through your application like a river.
- Downstream: This is the direction toward the end-user or the client. When you send data from your server to a user's browser, that data is traveling downstream.
- Upstream: This is the opposite direction away from the end-user and toward the source. When your application server needs to ask another service (like a database, a payment gateway, or another internal API) for data, it is making a request upstream.
So, in the context of a web application:
- Your application server (e.g., Node.js, Python/Django, Java/Spring) is downstream from the user's browser.
- The services your app server talks to (e.g., a MySQL database, a Redis cache, a third-party weather API) are upstream from your application server.
The "upstream" server is the one you depend on to complete a request. Your server is a client of it.
Think of it like this: you order food from a waiter (proxy server). The waiter goes to the kitchen (upstream server) and waits. But if the kitchen takes too long to prepare the dish, the waiter eventually comes back and says:
"Sorry, the kitchen didn’t respond in time."
That’s exactly what upstream request timeout means in networking and APIs.
So, What Exactly Is an "Upstream Request Timeout"?
Now that we know what "upstream" means, the definition becomes much clearer.
An upstream request timeout is an error that occurs when a server (like a reverse proxy or load balancer) that is acting on behalf of a client is waiting for a response from an upstream server, but that upstream server takes too long to reply. The waiting server gets impatient and gives up, returning a timeout error to the original client.
It's like sending a colleague an urgent email asking for a critical piece of information to finish your report. You wait and wait, but after 30 minutes, you haven't heard back. You can't wait any longer, so you have to send your report back to your boss incomplete, with a note saying, "I couldn't get the necessary info from my colleague in time." You've just experienced a human-level timeout.
The Key Players in This Drama
To see this in action, let's outline a typical web request flow:
- The User (Client): Your web browser or mobile app.
- The Reverse Proxy/Load Balancer (The Bouncer): This is often a service like Nginx, Apache, HAProxy, or a cloud provider's Load Balancer (AWS ALB, GCP CLB). Its job is to accept requests from the internet and forward them to the correct "backend" or "upstream" server where your application code actually lives.
- The Application Server (Your Code): This is the server running your Python, Java, JavaScript, Ruby, etc., code (e.g., Gunicorn, Tomcat, Node.js runtime, Unicorn).
- The Upstream Services (The Specialists): These are the services your application code calls, like:
- Databases (MySQL, PostgreSQL, MongoDB)
- Caching layers (Redis, Memcached)
- Other internal microservices (e.g., a "user service" or "payment service")
- External third-party APIs (Stripe, Twilio, Google Maps)
The timeout error specifically happens between Player 2 and Player 3. The Reverse Proxy (Nginx) has forwarded the request to the Application Server (your Node.js app). It starts a timer. If your Application Server doesn't send a full response back to the Reverse Proxy before that timer expires, the Reverse Proxy throws its hands up and sends a 504 Gateway Timeout error back to the User.
Crucially, note this: The timeout is between the proxy and your app server. Your app server might still be working, chugging away, trying to complete its task! But the proxy has already told the user that something went wrong.
The Difference Between Gateway Timeout vs Upstream Timeout
Developers often confuse 504 Gateway Timeout with upstream timeout errors. Let’s clear that up:
- Gateway Timeout (504) → This means the proxy or gateway (like Nginx, API Gateway, or Cloudflare) didn’t get a response in time from the upstream server.
- Upstream Request Timeout → A more specific case where the proxy explicitly gave up waiting for the upstream service.
So, all upstream request timeouts are essentially gateway timeouts, but the terminology just highlights where the delay occurred.
Why Does This Happen? The Usual Suspects
An upstream timeout is a symptom, not the disease. The disease is always that your application server is taking too long to respond. Let's investigate the common reasons why.
1. The Application Server is Genuinely Overwhelmed or Slow
This is the most straightforward cause. Your server is just too busy to handle the request in a timely manner.
- High CPU Usage: Your server might be pegged at 100% CPU because of a complex calculation, inefficient code, or just too much traffic. If it can't process requests quickly, responses get delayed.
- High Memory Usage: If your server is constantly garbage collecting or swapping memory to disk, everything grinds to a halt.
- Not Enough Resources: Simply put, you might need a bigger server or more application instances. Your single small server might not be able to handle the influx of requests.
2. The Upstream Services (that your App Server calls) are Slow
Remember, your application server is often a client to other services. If those services are slow, your app server gets stuck waiting, which makes it slow to respond to the reverse proxy.
- Database Woes: This is a huge culprit.
- Slow Queries: A missing database index can turn a 10ms query into a 10-second full-table scan.
- Database Locks: A long-running write operation can lock tables, blocking all subsequent read requests.
- High Database CPU: Your database server itself might be overwhelmed.
- Slow External API Calls: Is your app calling a third-party service that's having a bad day? If the Twitter API takes 20 seconds to respond, your app is forced to wait for 20 seconds before it can complete its own response.
- Network Issues: There might be network latency or packet loss between your application server and your database server, especially if they are in different data centers or availability zones.
3. It's a Long-Running Process (And That's Okay)
Sometimes, a request is supposed to take a long time. Generating a complex report, processing a large video file, or handling a large data export are all tasks that can take minutes, not milliseconds.
The problem here isn't that the process is slow; it's that we're using the wrong communication pattern. HTTP requests are not designed for long-lived connections lasting minutes. They are prone to being interrupted by network hiccups, browser closures, and... you guessed it... timeouts.
Real-World Scenarios Where This Error Happens
Let’s make this relatable with some examples:
- E-commerce checkout → A user clicks “Buy,” but the payment API upstream takes too long.
- Streaming apps → Video playback fails because the upstream CDN is slow.
- API integrations → Your app calls a third-party API, but their server is overloaded.
- Microservices → One microservice depends on another; if one is slow, the whole chain times out.
As you can see, this error pops up across industries and use cases.
How to Debug an Upstream Request Timeout
Alright, enough theory. Let's get practical. You see the error in your logs. What do you do next?
Step 1: Check Your Reverse Proxy Configuration
The first place to look is the configuration of your reverse proxy (e.g., Nginx). It defines the timeout thresholds.
In Nginx, the key directives are:
proxy_read_timeout: The time between two successive read operations from the upstream server. Default is often 60 seconds.proxy_connect_timeout: The time to establish a connection with the upstream server. Default is usually 60 seconds.proxy_send_timeout: The time between two successive write operations to the upstream server.
If your proxy_read_timeout is set to 30 seconds and your application consistently takes 31 seconds to respond, you'll get a 504 error every time. Knowing this value is your first clue.
Step 2: Instrument Your Application with Logging and APM
You need to find out where inside your application the time is being spent.
- Add Detailed Logging: Add logs at the start and end of major operations. "Starting user query," "Finished processing payment," etc. This will help you narrow down which endpoint or function is slow.
- Use an Application Performance Monitoring (APM) Tool: Tools like DataDog APM, New Relic, or AppDynamics are invaluable here. They automatically trace requests as they travel through your application and can show you a detailed breakdown of time spent:
- Time spent in your application code itself.
- Time spent waiting on each database query.
- Time spent on external HTTP calls to other services.
An APM dashboard can instantly tell you, "Ah, 95% of the request time is spent on this one SQL query!" or "The call to the Stripe API is taking 25 seconds!"
Step 3: Check Your Upstream Services
Once you've isolated the slow part, investigate the upstream service.
- For Databases: Examine slow query logs. Use
EXPLAIN(orEXPLAIN ANALYZE) on suspicious queries to see if they are missing indexes or doing full table scans. - For External APIs: Check the status pages of those services (e.g., status.stripe.com). Instrument your outgoing HTTP calls with logging to track their response times.
- For Caches: Check your cache hit/miss ratio. A low ratio means your app is going to the primary database more often than it should, which is slower.
How to Fix and Prevent Upstream Timeouts
Fixing the issue depends on the root cause you found during debugging.
Fix 1: Optimize Your Code and Queries
- Database Optimization: This is the lowest-hanging fruit. Add indexes, refactor inefficient queries, and consider using an ORM wisely (they can sometimes generate very inefficient queries).
- Code Optimization: Profile your application code. Are you doing inefficient loops? Processing huge datasets in memory? Use pagination, streaming, and more efficient algorithms.
- Implement Caching: This is a massive win. Use Redis or Memcached to store the results of expensive operations. The next time the same data is requested, it can be served from the blazing-fast cache in milliseconds instead of querying the slow database again.
Fix 2: Adjust Timeout Settings (But Be Careful!)
Sometimes, the right fix is to simply increase the timeout in your reverse proxy. This is appropriate if you've confirmed that the process is inherently long-running and cannot be easily optimized further.
However, this is a band-aid, not a cure. Increasing timeouts without understanding the root cause just sweeps the problem under the rug. It makes your system more resilient to slowness but doesn't make it any faster. It also ties up valuable resources (worker processes/threads) on your reverse proxy and application server for longer, which can make your system more vulnerable to traffic spikes.
Fix 3: Use the Right Pattern for Long-Running Jobs
For tasks that legitimately take minutes or hours, do not handle them inside the HTTP request/response cycle.
Instead, use an asynchronous pattern:
- The HTTP request triggers the job to be created and placed in a queue (like RabbitMQ, AWS SQS, or Redis).
- The application immediately responds with a
202 Acceptedstatus and a unique job ID (e.g.,{"status": "processing", "job_id": "abc123"}). - A separate background worker process (or a serverless function) pulls jobs from the queue and processes them.
- The client can later poll a separate status endpoint (e.g.,
GET /jobs/abc123) to check if the job is complete and get the result.
This keeps your HTTP connections short and snappy and prevents timeouts entirely for long operations.
Fix 4: Scale Your Infrastructure
If the issue is pure volume, you need to scale.
- Scale Up (Vertical Scaling): Get a bigger server with more CPU and RAM.
- Scale Out (Horizontal Scaling): Add more instances of your application server behind your load balancer. This is generally the more modern and resilient approach.
How Apidog Can Help You Vanquish Timeout Demons
This is where a powerful API toolset moves from being a nice-to-have to a critical part of your workflow. Apidog is an incredible all-in-one platform that combines the functionality of tools like Postman, Swagger, and Mock servers into one seamless experience.
Here’s how it directly helps with timeout issues:
- Precise Performance Testing: You can use Apidog to script and run requests against your API while meticulously tracking the response time for every single call. You can easily establish a performance baseline and see immediately if a new code change causes a regression and increased latency.
- Debugging with Clarity: When a request fails, Apidog gives you a complete picture of the entire request-response lifecycle. You can see exactly how long each step took, making it easier to pinpoint if the delay was in the connection phase, waiting for the first byte, or downloading the response.
- Designing for Resilience: By using Apidog to design and prototype your APIs, you can build in best practices from the start. You can model the asynchronous pattern we discussed, ensuring your API specs clearly define fast responses that kick off background jobs rather than forcing long-running processes into a synchronous call.
- Collaboration: Share your API documentation and test cases with your team in Apidog. If a frontend developer is experiencing timeouts, they can quickly check the expected behavior and performance thresholds right in the shared documentation, eliminating confusion.
Using a tool like Apidog transforms timeout debugging from a frustrating game of guesswork into a structured, data-driven investigation.
Conclusion: Taming the Timeout Beast
So, what does "upstream request timeout" mean? In essence, it’s when a proxy server waits too long for a response from an upstream service and eventually gives up; it's a cry for help from your infrastructure. It's your reverse proxy telling you, "Hey, I asked your application for an answer, but it's taking way too long, and I have other requests to handle!"
Understanding this error is a fundamental part of building robust and reliable systems. While the error might look scary, the good news is it’s fixable. It’s not just about fixing a configuration value; it’s about adopting a mindset of performance and resilience. By methodically debugging with the right tools, robust API monitoring, optimizing your bottlenecks, better configuration, choosing the correct architectural patterns for long tasks, and proactively monitoring your stack, you can dramatically transform this dreaded error from a frequent nightmare into a rare occurrence.
Remember, the goal isn't to eliminate timeouts entirely that's impossible. The goal is to understand them, handle them gracefully, and build systems that are resilient enough to handle the occasional slow response without breaking the experience for your users.
And if APIs are a core part of your stack (which they likely are), don’t leave them unchecked. Start monitoring them today with Apidog. It’s built for developers and testers who want to design, test, and monitor APIs effortlessly, and take the first step in preventing API-related timeouts.
Now go forth, and may your responses be swift and your timeouts be few!