Debug web applications faster than ever by integrating Chrome DevTools with your AI coding assistant. Discover how the Chrome DevTools MCP Server empowers developers to enable real-time browser debugging, performance analysis, and user flow testing—directly from AI agents inside VS Code, Gemini CLI, or Cursor.
For API-focused teams, ensuring your development workflow is efficient and collaborative is crucial. If you’re searching for an API testing platform that generates beautiful API Documentation and boosts team productivity, Apidog is designed to streamline your API lifecycle—offering a more affordable alternative to Postman.
What Is the Chrome DevTools MCP Server?
The Chrome DevTools MCP (Model Context Protocol) Server is an open-source bridge that connects large language models (LLMs) to Chrome’s robust DevTools environment. With this integration, your AI assistant can:
- Launch and control Chrome browsers
- Access live DOM, CSS, and JavaScript runtime data
- Collect performance traces and Lighthouse reports
- Simulate real user actions (clicks, form submissions, navigation)
- Debug layout, network, and console issues in real time
Instead of generating code “blind,” your AI agent can validate, inspect, and optimize code changes directly in a real browser. This leads to smarter, faster troubleshooting and development.
Why Integrate Chrome DevTools MCP Server with Your AI Assistant?
Connecting Chrome DevTools to your AI coding environment unlocks several developer advantages:
-
Real-Time Validation: Instantly verify code changes in a live Chrome browser.
Prompt Example:
“Verify in the browser that your change works as expected.” -
Network and Console Debugging: Diagnose CORS issues, API failures, and runtime errors as they happen.
Prompt Example:
“A few images on localhost:8080 are not loading. What’s happening?” -
Simulate User Actions: Automate flows like form submissions and multi-step navigation to reproduce and fix bugs.
Prompt Example:
“Why does submitting the form fail after entering an email address?” -
DOM & CSS Inspection: Identify and resolve styling or layout issues with live DOM and CSS data.
Prompt Example:
“The page on localhost:8080 looks strange. Check what’s happening there.” -
Automate Performance Audits: Run Lighthouse-like checks to optimize web performance.
Prompt Example:
“Localhost:8080 is loading slowly. Make it load faster.”
For API developers and QA engineers, this means you can close the loop between code generation, browser testing, and real debugging—all powered by AI.
How to Install the Chrome DevTools MCP Server
The Chrome DevTools MCP Server can be integrated with your workflow in VS Code, Cursor, or Gemini CLI. Here’s how to set it up in each:
1. Installing in VS Code
-
Open VS Code.
-
Use Ctrl + Shift + P (Windows/Linux) or Cmd + Shift + P (Mac) to open the Command Palette.
-
Search for “MCP” and select Add MCP Server.
-
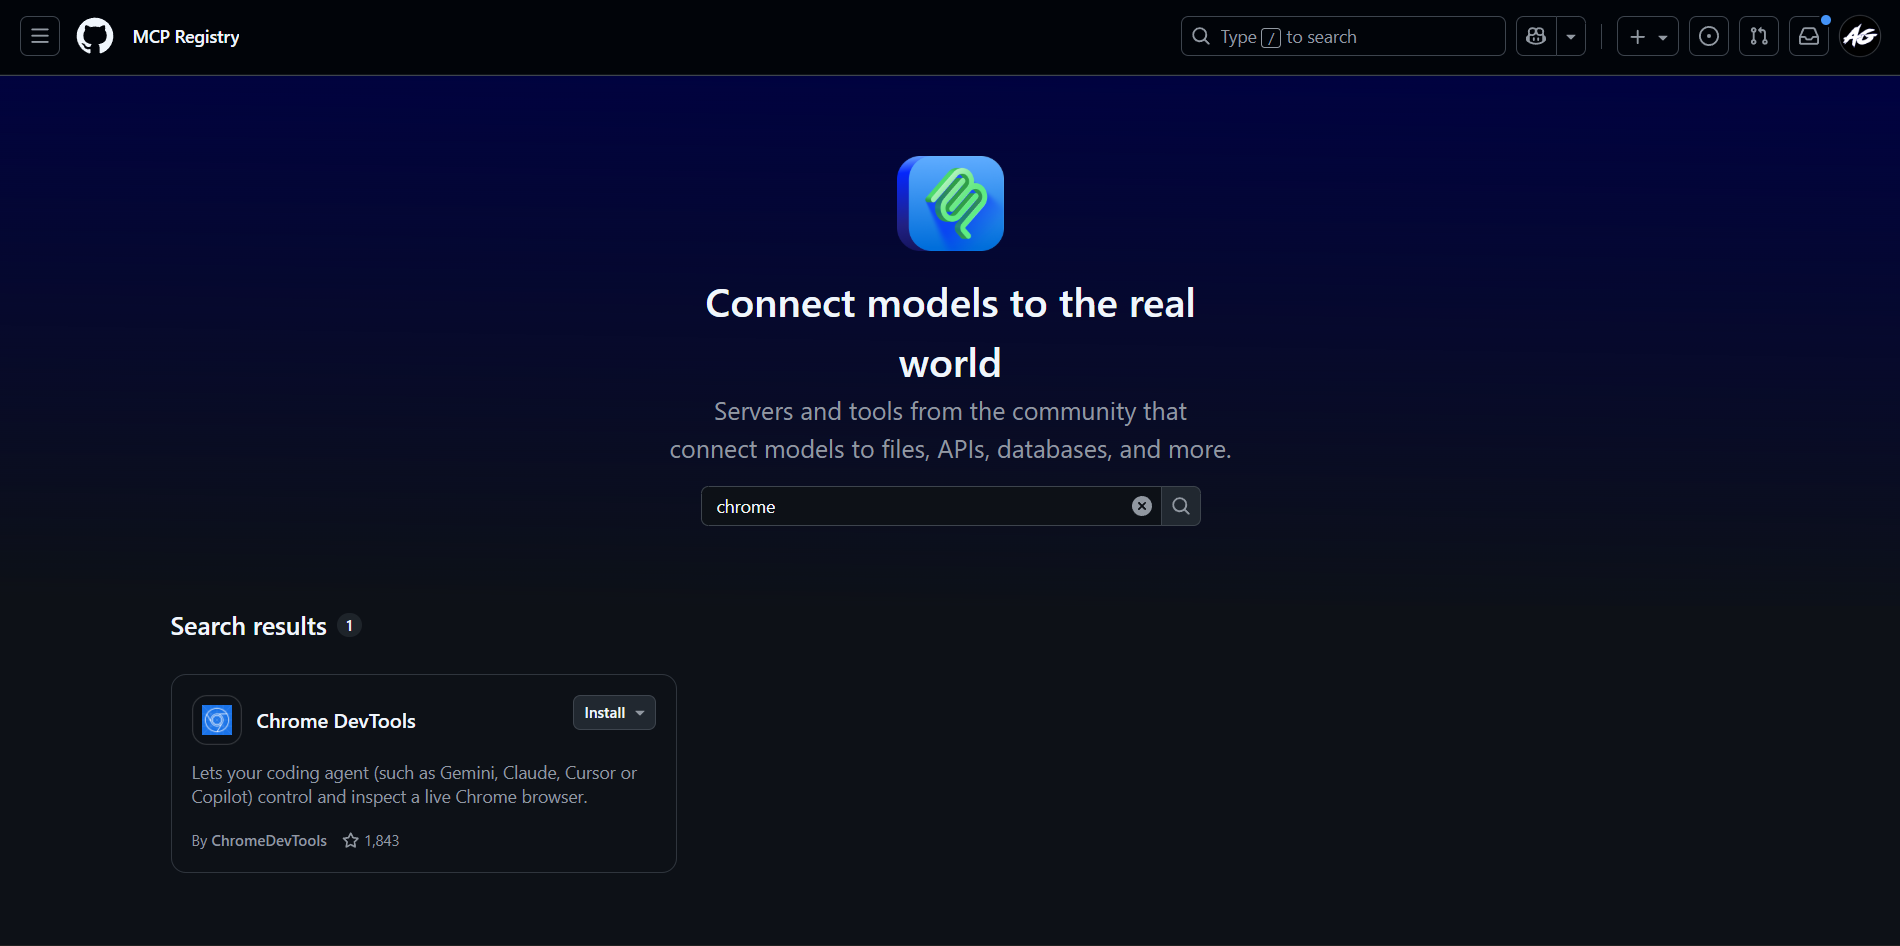
Click Browse MCP Servers in the Extensions sidebar.
-
On the redirected web page, search “Chrome Dev Tools MCP Server” (use the keyword "chrome").
-
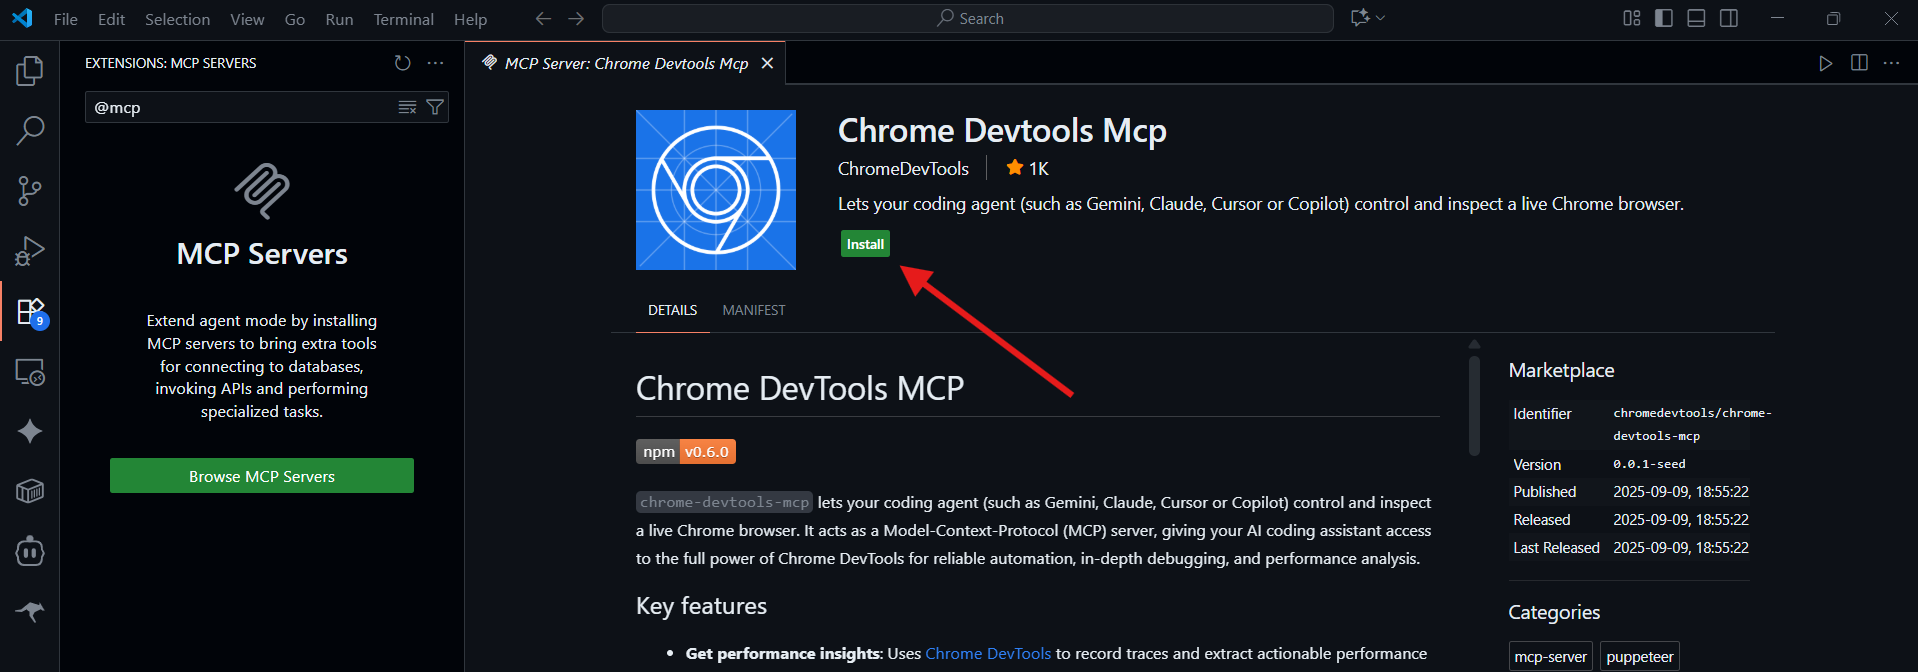
Click Install, then select Install in VS Code.
- Once installed, your AI assistant in VS Code can connect to Chrome for live debugging.
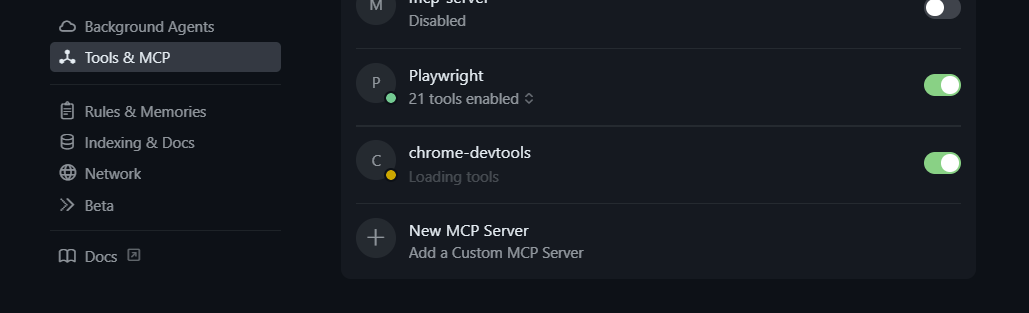
2. Installing in Cursor
- Launch the Cursor Editor.
- Navigate to Settings > Tools & MCP.
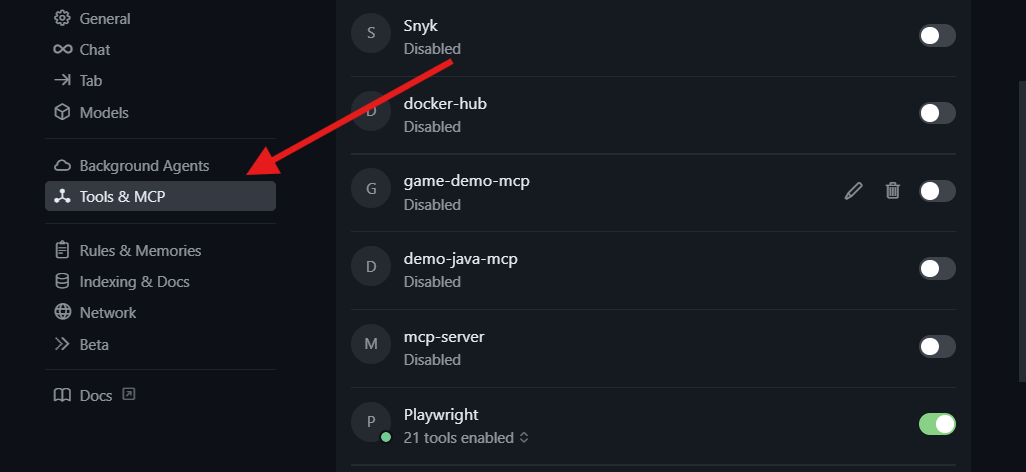
- Click New MCP Server to edit the MCP configuration JSON file.
- Add the following configuration:
{
  "mcpServers": {
    "chrome-devtools": {
      "command": "npx",
      "args": ["chrome-devtools-mcp@latest"]
    }
  }
}
- Save and restart Cursor.
Cursor will now recognize the Chrome DevTools MCP Server and enable browser-based debugging with your AI assistant.
3. Installing in Gemini CLI (Recommended)
Gemini users can connect to the Chrome DevTools MCP Server for full debugging capabilities:
- Locate the
settings.jsonfile in your.geminifolder (usually in your user root directory). - Open it with your code editor, or via terminal:
cd ~
cd .gemini
code settings.json
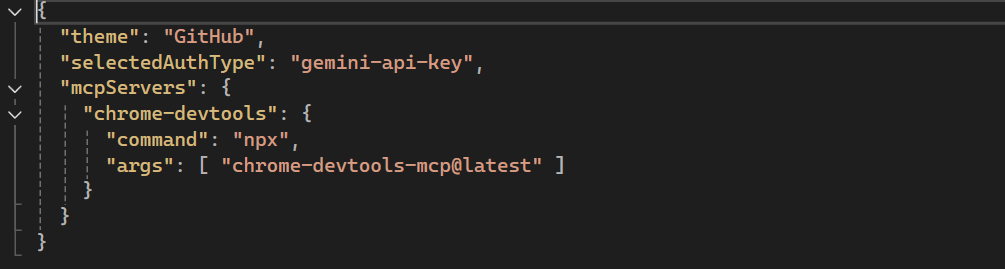
- Add the following configuration:
{
  "mcpServers": {
    "chrome-devtools": {
      "command": "npx",
      "args": ["chrome-devtools-mcp@latest"]
    }
  }
}
- Save and close the file. It should look like this:
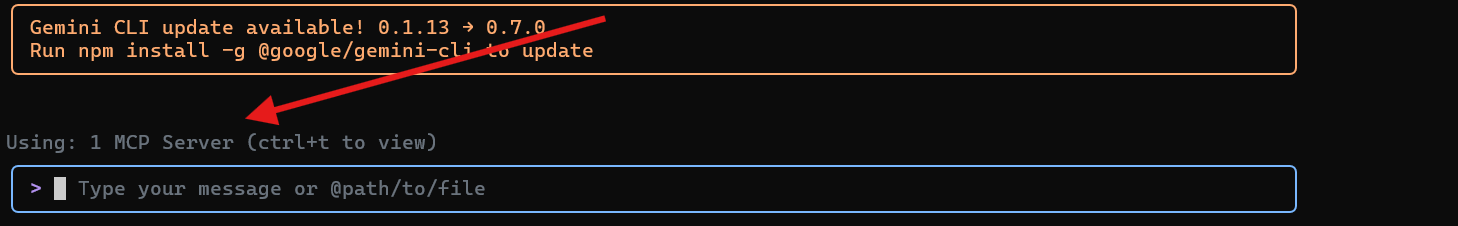
- Open Gemini and run
/mcpto confirm the server is installed.
You should see the Chrome DevTools MCP Server listed and ready for connection.
How to Use the Chrome DevTools MCP Server
Once installed, interact with the server through prompts in your AI assistant. Here are practical use cases:
-
Performance Analysis:
“Please check the LCP (Largest Contentful Paint) of web.dev.”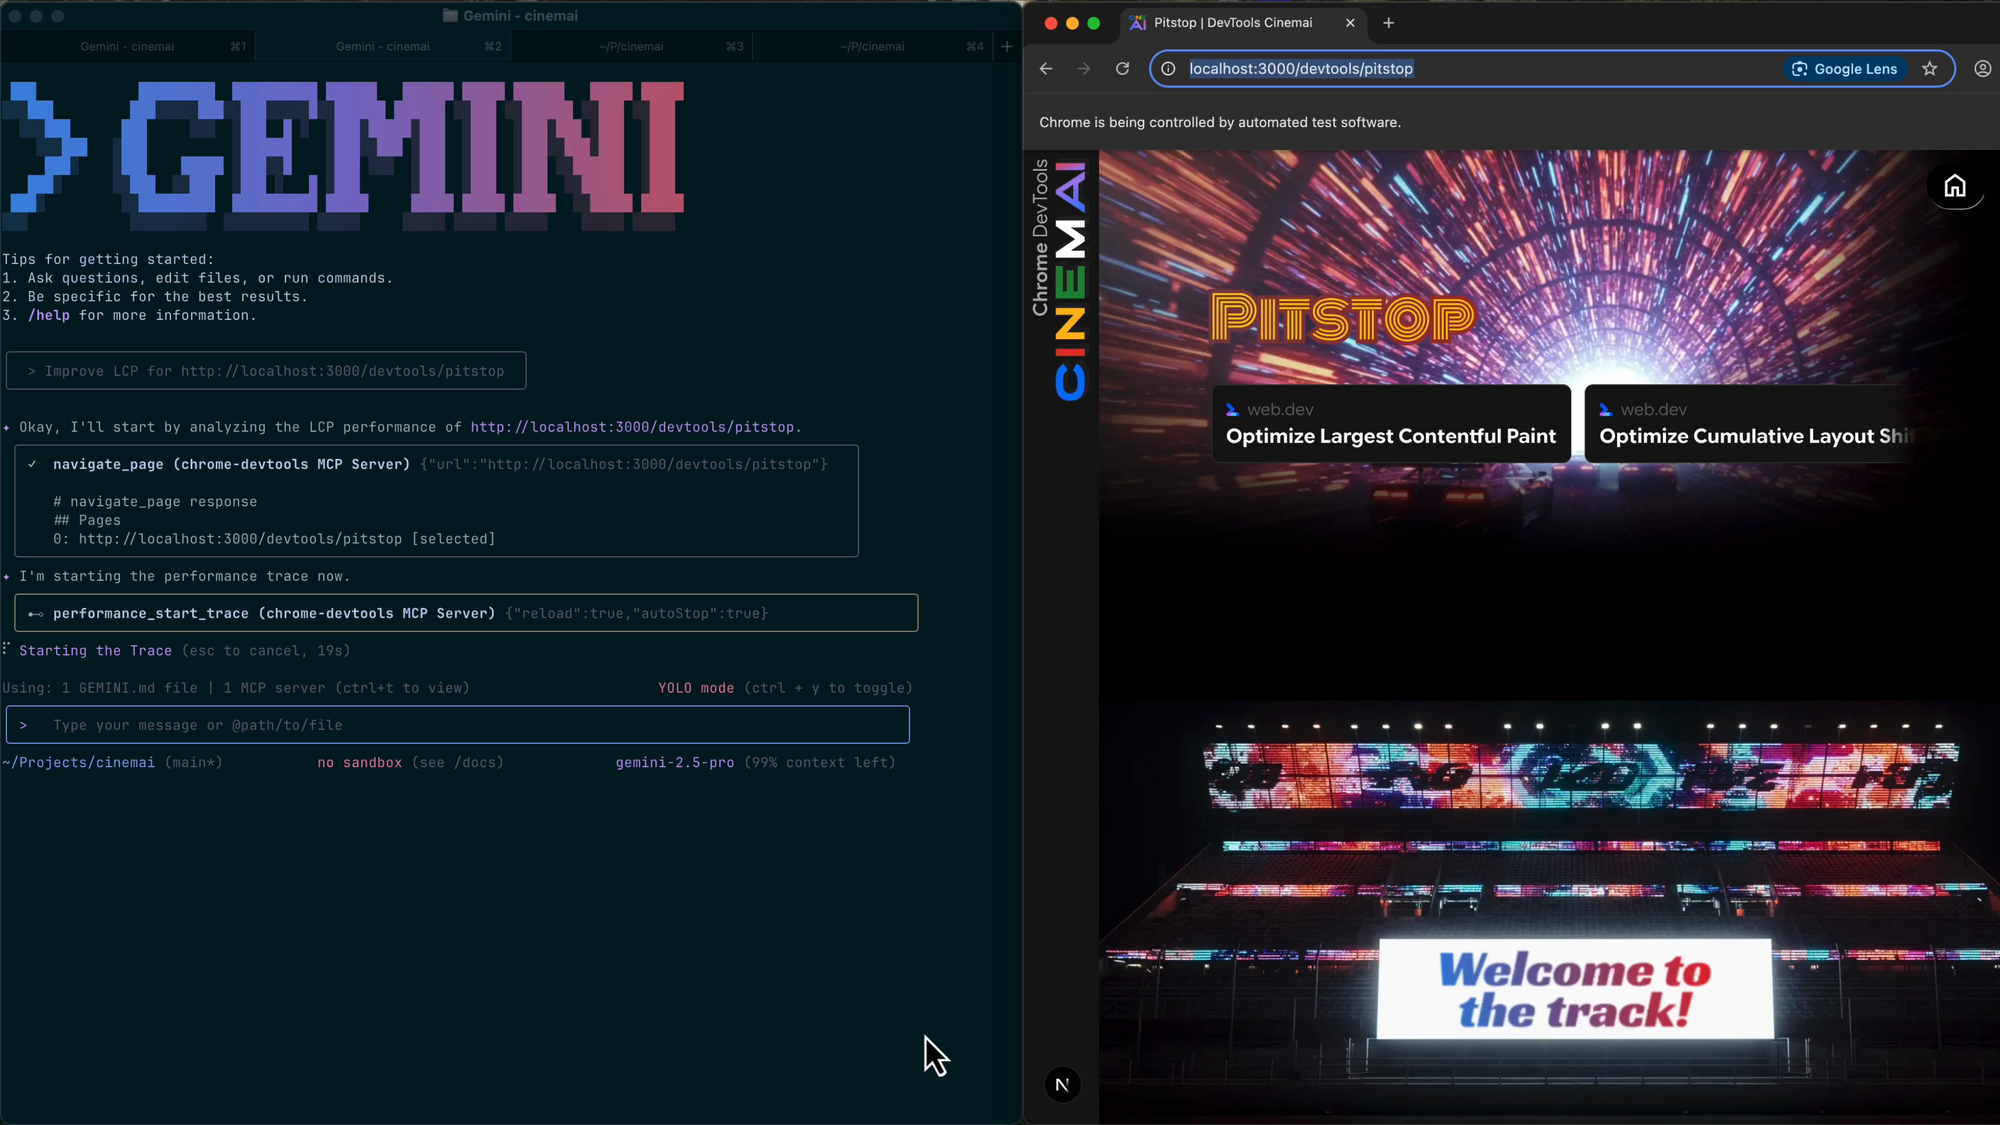
-
CSS Debugging:
“Inspect localhost:8080 and fix the overflowing elements in the header.” -
Console & Network Logs:
“Analyze the console errors when submitting the login form on localhost:3000.” -
Simulating User Flows:
“Navigate to the signup page, fill the form, and tell me why submission fails.”
With this setup, your AI agent doesn’t just write code—it tests and debugs it like a real developer in the browser.
Advanced Features
-
Automated Tracing:
Use theperformance_start_tracetool to collect and analyze performance traces automatically. -
Live DOM & CSS Inspection:
AI agents can inspect live web pages, diagnose structure issues, and suggest targeted code fixes. -
Consistent, Scalable Workflows:
Since MCP is editor-agnostic, you can use the same server setup across different tools and teams.
Roadmap & Community Involvement
The Chrome DevTools MCP Server is in public preview. Expect rapid feature development, including:
- Deeper Lighthouse and Core Web Vitals integration
- Advanced simulation of multi-step user flows
- Richer AI-driven issue visualization
- Multi-tab and multi-device debugging support
Stay updated via the Chrome Developers Blog or contribute feedback and suggestions on GitHub.
Conclusion
Integrating the Chrome DevTools MCP Server with your AI coding assistant bridges the gap between code generation and real web debugging. This direct connection allows your AI agent to inspect, test, and optimize applications in a real browser—enabling faster troubleshooting and higher code quality.
For teams building and testing APIs, combining browser-based debugging with a collaborative API platform like Apidog ensures your workflows are both efficient and robust.
Ready to supercharge your development environment? Connect your AI assistant to Chrome DevTools today and experience the future of intelligent debugging.