In today's digital landscape, APIs form the backbone of modern applications, facilitating seamless communication between different software systems. As the demand for robust and scalable APIs continues to grow, it becomes increasingly crucial to ensure their performance under various load conditions. This comprehensive guide explores the top 10 techniques and tools for API performance testing at scale, providing developers and QA professionals with the knowledge and resources needed to optimize their API performance.
1. Apidog: The All-in-One API Testing Powerhouse
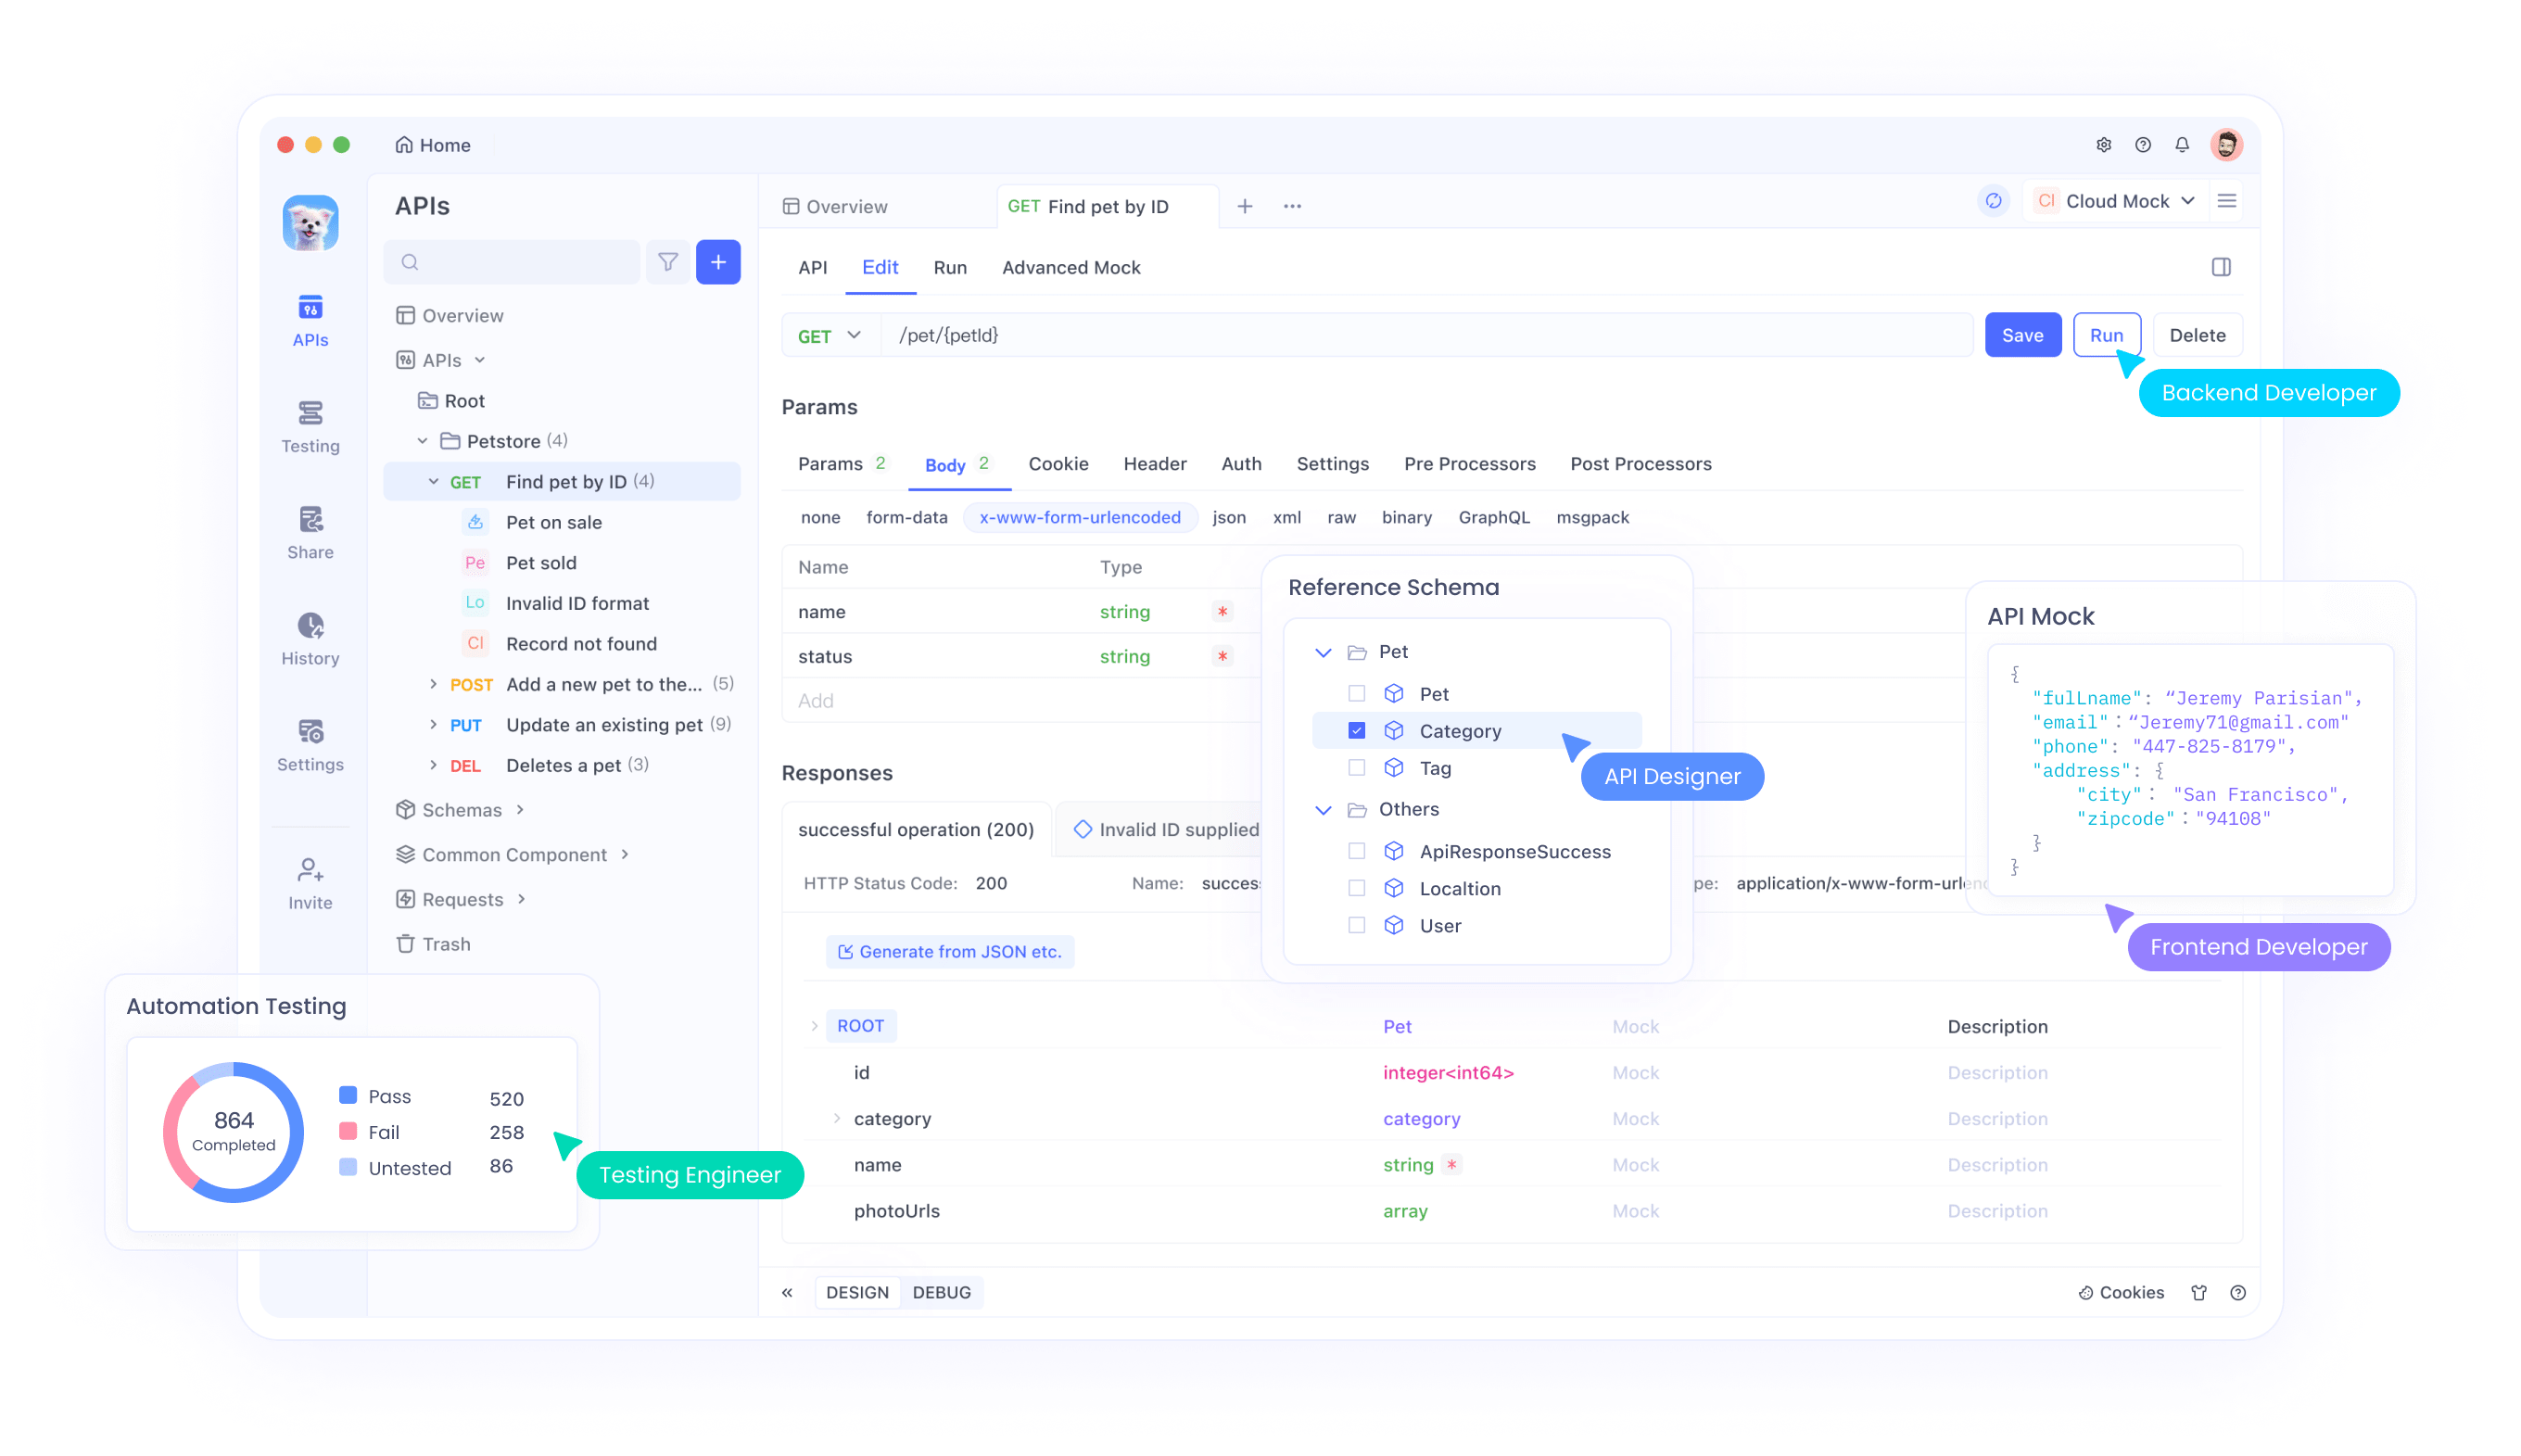
When it comes to performance testing APIs at scale, Apidog stands out as a versatile and powerful tool that combines multiple functionalities into a single platform. This comprehensive solution offers a range of features specifically designed to streamline the API testing process and ensure optimal performance.

Key Features of Apidog for API Performance Testing
- Visual API Builder: Apidog's intuitive interface allows users to create and modify API tests without writing complex code, making it accessible to both developers and non-technical team members.
- Automated Test Generation: The platform can automatically generate test cases based on API specifications, saving time and reducing the likelihood of human error.
- Load Testing Capabilities: Apidog offers built-in load testing features that enable users to simulate high-volume traffic and assess API performance under stress.
- Real-time Monitoring: During test execution, Apidog provides real-time performance metrics, allowing testers to identify bottlenecks and issues as they occur.
- Comprehensive Reporting: Detailed reports and analytics offer insights into API performance, helping teams make data-driven decisions for optimization.
Implementing Performance Tests with Apidog
To leverage Apidog for API performance testing, follow these steps:
- Define your API endpoints and test scenarios within the Apidog interface.
- Configure load test parameters, such as the number of virtual users and test duration.
- Execute the performance test and monitor real-time results.
- Analyze the generated reports to identify performance bottlenecks and areas for improvement.
Example of setting up a load test in Apidog:
// Apidog load test configuration
const loadTest = {
  endpoint: 'https://api.example.com/users',
  method: 'GET',
  virtualUsers: 1000,
  rampUpPeriod: 60, // seconds
  duration: 300, // seconds
  assertions: [
    { type: 'responseTime', maxValue: 500 }, // ms
    { type: 'successRate', minValue: 99.5 } // percentage
  ]
};

apidog.runLoadTest(loadTest);
By utilizing Apidog's comprehensive features, development teams can efficiently test and optimize their APIs for performance at scale, ensuring a smooth user experience even under high load conditions. For more details, visit Apidog's help center to better understand the platform’s capabilities.
2. Apache JMeter: The Open-Source Performance Testing Titan
Apache JMeter has long been a staple in the performance testing world, and its capabilities for API testing at scale are no exception. This powerful, open-source tool offers a wide range of features that make it an excellent choice for developers and QA teams looking to thoroughly assess their API's performance under various conditions.

Leveraging JMeter for API Performance Testing
JMeter's flexibility and extensibility make it particularly well-suited for API performance testing at scale. Here are some key aspects of using JMeter for this purpose:
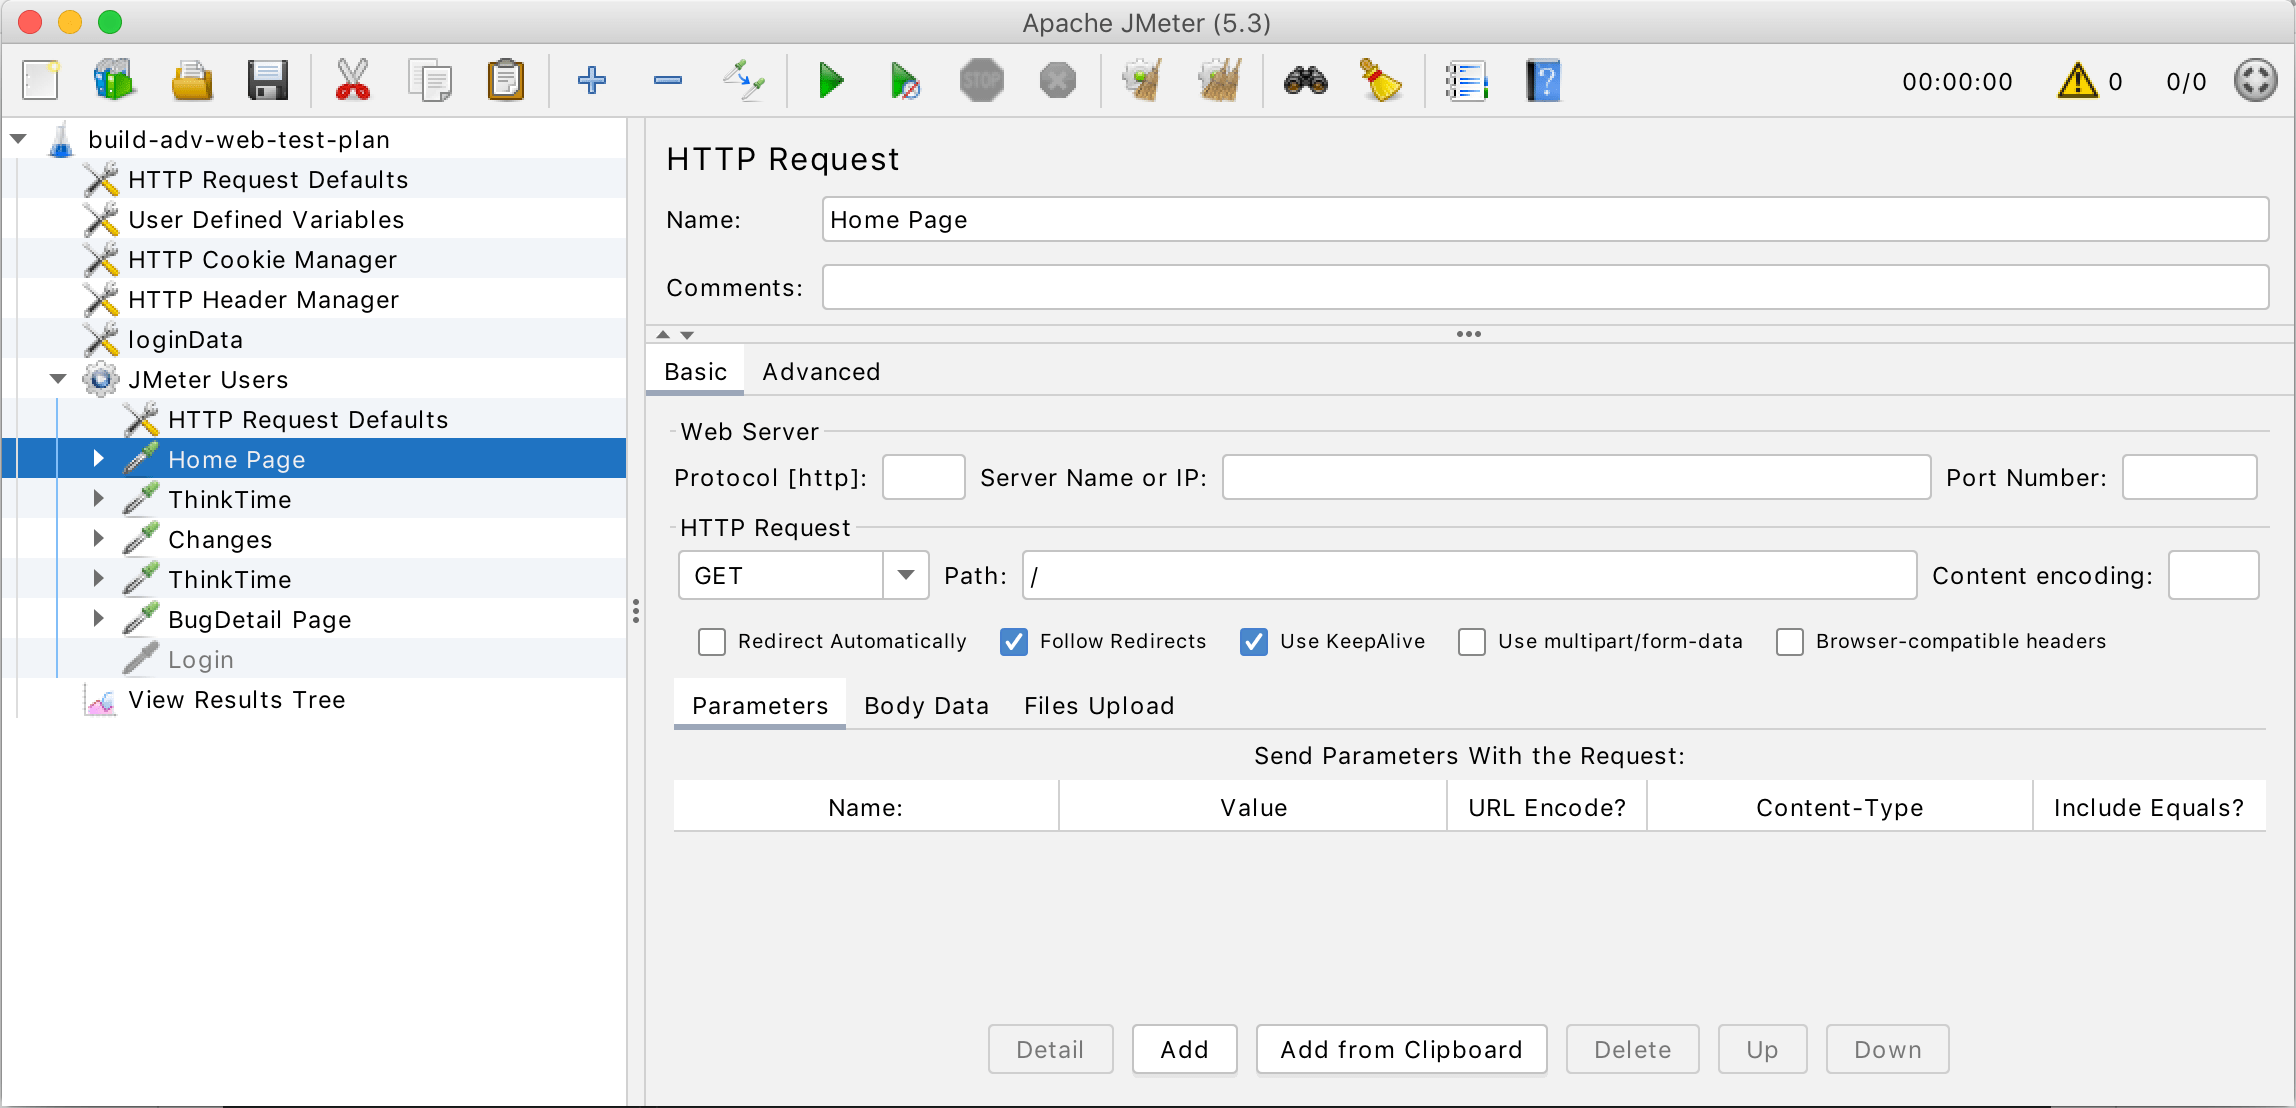
- Thread Groups: Simulate multiple users accessing your API concurrently.
- HTTP Request Samplers: Create requests to your API endpoints with customizable parameters.
- Assertions: Validate API responses to ensure correctness under load.
- Listeners: Collect and visualize test results in real-time.
- Plugins: Extend JMeter's functionality with a vast ecosystem of plugins.
Setting Up an API Performance Test in JMeter
To create a basic API performance test in JMeter:
- Create a Thread Group to define the number of virtual users.
- Add an HTTP Request sampler for your API endpoint.
- Configure test parameters such as headers, body, and authentication.
- Add listeners to collect and analyze results.
- Run the test and analyze the output.
Example JMeter test plan structure:
<?xml version="1.0" encoding="UTF-8"?>
<jmeterTestPlan version="1.2" properties="5.0" jmeter="5.4.1">
  <hashTree>
    <ThreadGroup guiclass="ThreadGroupGui" testclass="ThreadGroup" testname="API Load Test" enabled="true">
      <stringProp name="ThreadGroup.num_threads">100</stringProp>
      <stringProp name="ThreadGroup.ramp_time">10</stringProp>
      <boolProp name="ThreadGroup.scheduler">false</boolProp>
      <stringProp name="ThreadGroup.duration"></stringProp>
      <stringProp name="ThreadGroup.delay"></stringProp>
    </ThreadGroup>
    <hashTree>
      <HTTPSamplerProxy guiclass="HttpTestSampleGui" testclass="HTTPSamplerProxy" testname="API Request" enabled="true">
        <stringProp name="HTTPSampler.domain">api.example.com</stringProp>
        <stringProp name="HTTPSampler.port">443</stringProp>
        <stringProp name="HTTPSampler.protocol">https</stringProp>
        <stringProp name="HTTPSampler.path">/users</stringProp>
        <stringProp name="HTTPSampler.method">GET</stringProp>
      </HTTPSamplerProxy>
      <hashTree/>
      <ResultCollector guiclass="ViewResultsFullVisualizer" testclass="ResultCollector" testname="View Results Tree" enabled="true"/>
      <hashTree/>
    </hashTree>
  </hashTree>
</jmeterTestPlan>
JMeter's robust feature set and active community make it a powerful tool for performance testing APIs at scale, allowing teams to identify and address performance issues before they impact end-users.
3. Gatling: High-Performance Load Testing for APIs
Gatling is a modern load testing tool that excels in performance testing APIs at scale. Its Scala-based domain-specific language (DSL) and asynchronous architecture make it particularly well-suited for simulating high-concurrency scenarios, which is crucial for testing APIs under extreme load conditions.

Key Advantages of Gatling for API Performance Testing
- Scala DSL: Write expressive and maintainable test scenarios using Scala.
- Asynchronous Design: Efficiently handle a large number of concurrent connections.
- Real-time Metrics: Monitor test progress and results in real-time.
- Detailed Reports: Generate comprehensive HTML reports with performance insights.
- Jenkins Integration: Easily integrate with CI/CD pipelines for automated testing.
Creating an API Performance Test with Gatling
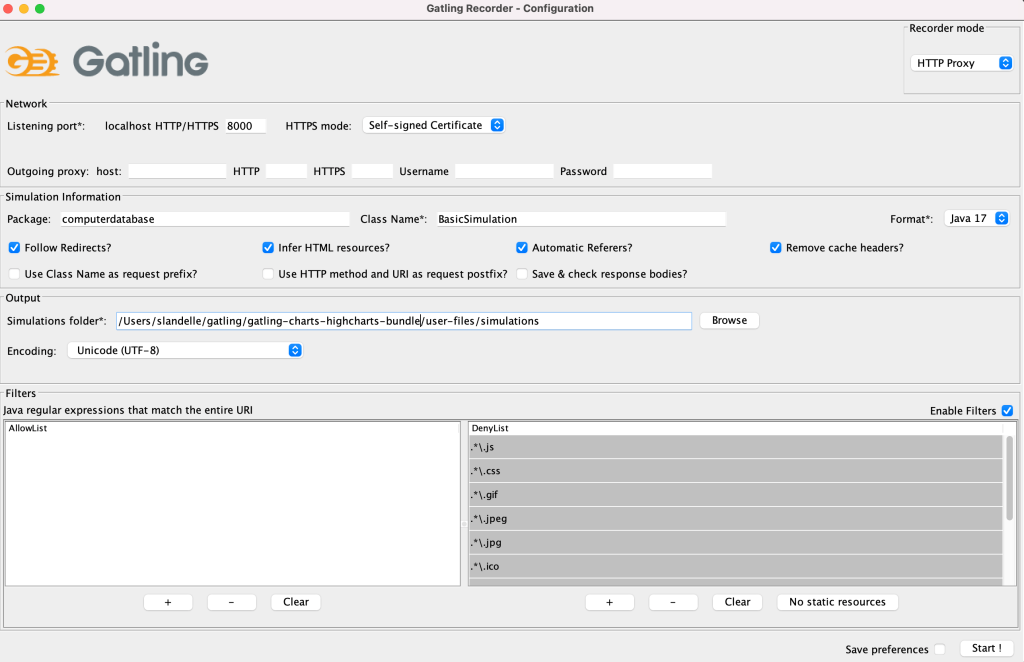
To set up a basic API performance test using Gatling:
- Define your simulation class extending the
Simulationtrait. - Create an HTTP protocol configuration.
- Define your scenario with API requests and user behavior.
- Configure the load simulation parameters.
- Run the test and analyze the results.
Example Gatling simulation for API testing:
import io.gatling.core.Predef._
import io.gatling.http.Predef._
import scala.concurrent.duration._

class APILoadTest extends Simulation {
  val httpProtocol = http
    .baseUrl("https://api.example.com")
    .acceptHeader("application/json")

  val scn = scenario("API Test")
    .exec(http("Get Users")
      .get("/users")
      .check(status.is(200)))
    .pause(1)

  setUp(
    scn.inject(
      rampUsers(1000) during (1 minute)
    )
  ).protocols(httpProtocol)
}
Gatling's focus on high performance and scalability makes it an excellent choice for teams looking to push their APIs to the limit and ensure they can handle massive loads without compromising on response times or reliability.
4. Postman: From API Development to Performance Testing
While primarily known as an API development and testing tool, Postman has evolved to include powerful features for performance testing APIs at scale. Its intuitive interface and extensive feature set make it an attractive option for teams looking to seamlessly integrate performance testing into their API development workflow.

Postman's Approach to API Performance Testing
Postman offers several features that facilitate performance testing of APIs:
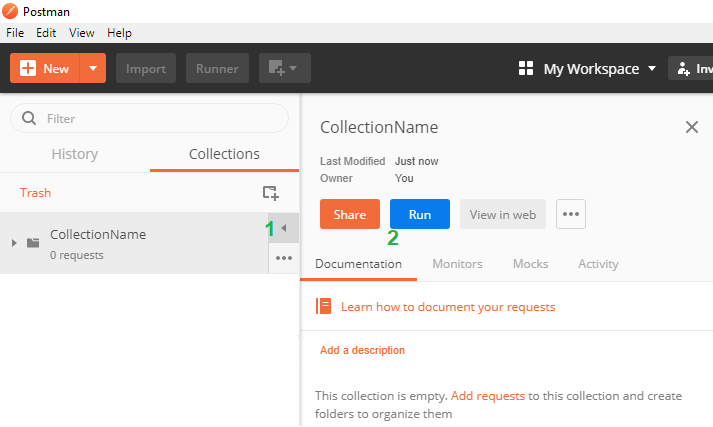
- Collection Runner: Execute a series of API requests in sequence or parallel.
- Newman: Command-line tool for running Postman collections, ideal for CI/CD integration.
- Monitors: Schedule and run API tests in the cloud to simulate global traffic.
- Visualizations: Create custom visualizations of test results for easy analysis.
Setting Up Performance Tests in Postman
To conduct a performance test using Postman:
- Create a collection of API requests to be tested.
- Configure test scripts to validate responses and measure performance.
- Use the Collection Runner to execute multiple iterations of the requests.
- Analyze the results using Postman's built-in visualizations or export data for further analysis.
Example of a Postman test script for performance measurement:
pm.test("Response time is acceptable", function () {
    pm.expect(pm.response.responseTime).to.be.below(200);
});

pm.test("Status code is 200", function () {
    pm.response.to.have.status(200);
});

// Log response time for later analysis
console.log("Response Time: " + pm.response.responseTime + "ms");
While Postman may not offer the same level of scalability as dedicated load testing tools, its integration with the API development process makes it a valuable asset for teams looking to incorporate performance testing early in the development cycle.
5. K6: Modern Performance Testing for Developers
K6 is a modern, developer-centric load testing tool that excels in performance testing APIs at scale. Its JavaScript-based scripting and focus on developer experience make it an excellent choice for teams looking to integrate performance testing into their development workflow seamlessly.

Why K6 Stands Out for API Performance Testing
- JavaScript API: Write tests using familiar JavaScript syntax.
- Local and Cloud Execution: Run tests locally or in the cloud for distributed load generation.
- Extensibility: Extend functionality with custom metrics and outputs.
- CI/CD Integration: Easily integrate with popular CI/CD tools.
- Prometheus and Grafana Integration: Visualize test results in real-time.
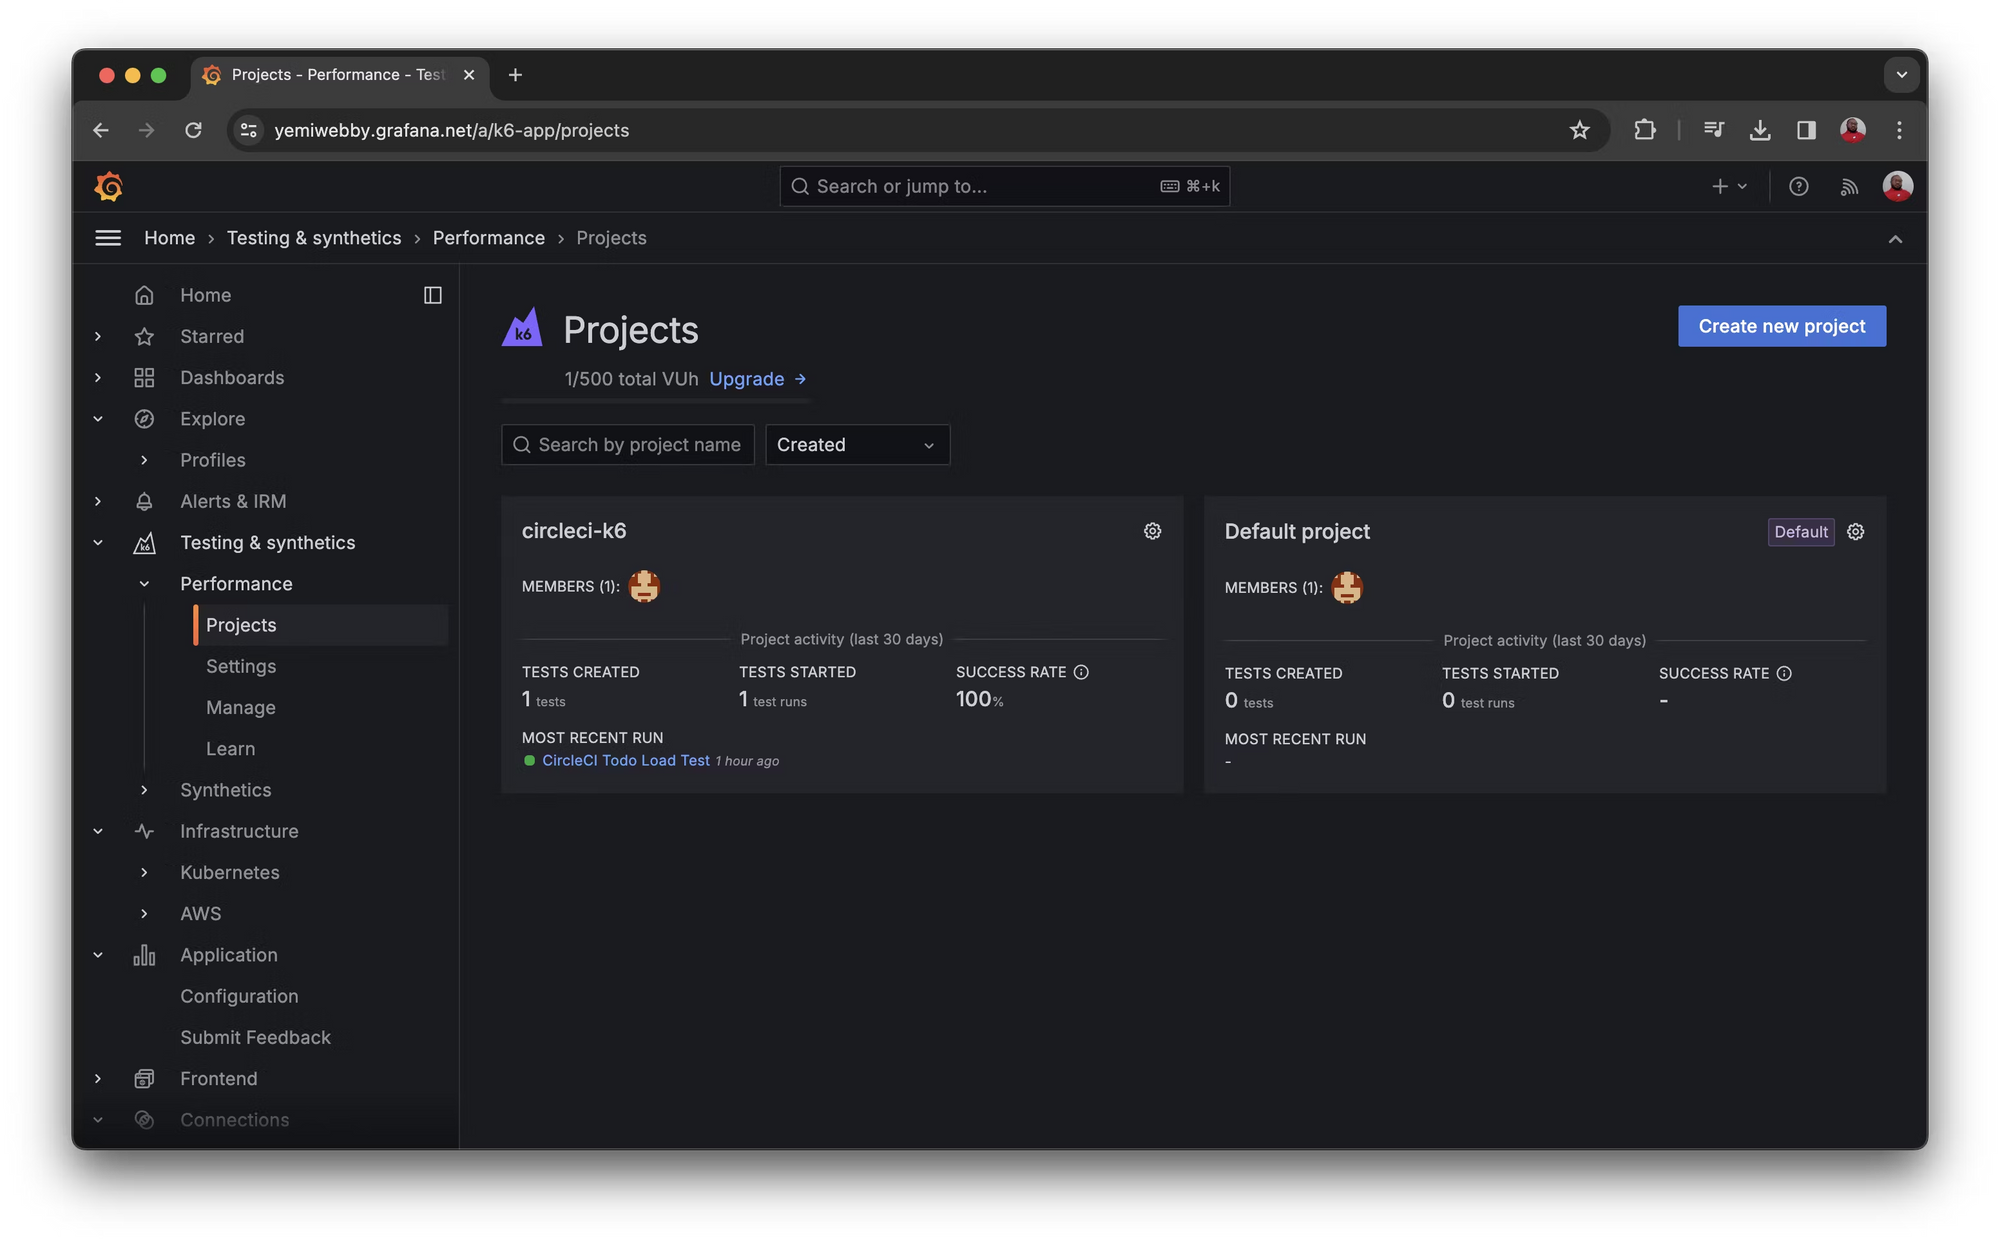
Crafting API Performance Tests with K6
To create a performance test for your API using K6:
- Write your test script in JavaScript.
- Define virtual user scenarios and API requests.
- Set performance thresholds and test duration.
- Execute the test locally or in the cloud.
- Analyze results and optimize your API based on insights.
Example K6 script for API performance testing:
import http from 'k6/http';
import { check, sleep } from 'k6';

export let options = {
  vus: 100,
  duration: '5m',
};

export default function() {
  let res = http.get('https://api.example.com/users');
  check(res, {
    'status is 200': (r) => r.status === 200,
    'response time < 500ms': (r) => r.timings.duration < 500,
  });
  sleep(1);
}
K6's developer-friendly approach and powerful features make it an excellent tool for teams looking to shift left with performance testing, catching and addressing API performance issues early in the development process.
6. BlazeMeter: Cloud-Based Performance Testing at Scale
BlazeMeter offers a robust, cloud-based solution for performance testing APIs at scale. Its ability to simulate massive user loads from multiple geographic locations makes it an ideal choice for organizations looking to test global API performance under realistic conditions.
BlazeMeter's Strengths in API Performance Testing
- Massive Scalability: Simulate millions of virtual users from various global locations.
- Multi-Protocol Support: Test RESTful, SOAP, GraphQL, and other API types.
- Test Composition: Create complex scenarios combining different test types.
- Real-Time Analytics: Monitor and analyze test results as they happen.
- Integration Capabilities: Seamlessly integrate with CI/CD tools and APM solutions.
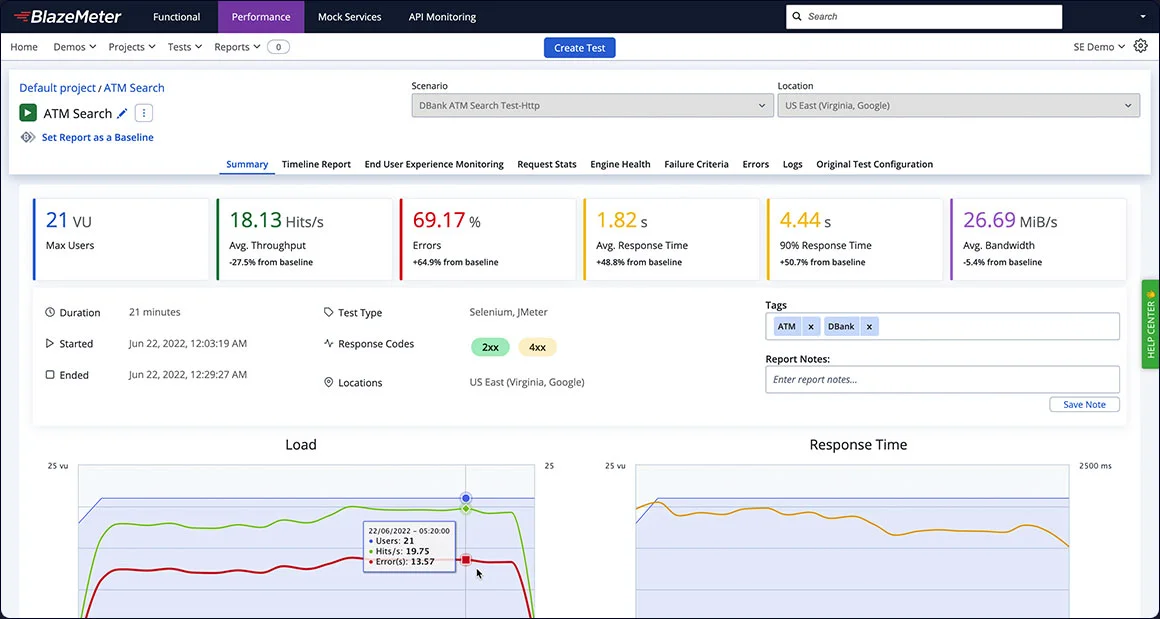
Implementing API Performance Tests with BlazeMeter
To set up an API performance test using BlazeMeter:
- Create or import your test script (supports JMeter, Gatling, and other formats).
- Configure test parameters such as user load, ramp-up time, and test duration.
- Select geographic locations for load generation.
- Execute the test and monitor real-time results.
- Analyze comprehensive reports and share results with stakeholders.
Example BlazeMeter test configuration (in YAML format):
execution:
- concurrency: 1000
  ramp-up: 5m
  hold-for: 30m
  scenario: api-test

scenarios:
  api-test:
    requests:
    - url: https://api.example.com/users
      method: GET
      headers:
        Content-Type: application/json
    - url: https://api.example.com/orders
      method: POST
      body: '{"product_id": 123, "quantity": 1}'

reporting:
- module: final-stats
- module: console
BlazeMeter's cloud-based approach and extensive features make it a powerful tool for organizations needing to conduct large-scale, geographically distributed API performance tests with ease and flexibility.
7. Apache Benchmark (ab): Lightweight Command-Line Performance Testing
Apache Benchmark (ab) is a simple yet effective command-line tool for performance testing HTTP servers, including APIs. While it may not offer the advanced features of some other tools on this list, its simplicity and ease of use make it an excellent option for quick performance checks and baseline measurements.

Advantages of Apache Benchmark for API Testing
- Simplicity: Easy to use with a straightforward command-line interface.
- Low Resource Usage: Ideal for running tests on resource-constrained systems.
- Quick Results: Provides fast feedback on API performance.
- Customizable: Supports various options to tailor tests to specific needs.
- Cross-Platform: Available on multiple operating systems.
Running API Performance Tests with Apache Benchmark
To conduct a basic API performance test using Apache Benchmark:
- Open a terminal or command prompt.
- Use the
abcommand with appropriate options to specify the test parameters. - Analyze the output for key performance metrics.
Example Apache Benchmark command for API testing:
ab -n 10000 -c 100 -H "Accept: application/json" https://api.example.com/usersThis command sends 10,000 requests with 100 concurrent users to the specified API endpoint.Apache Benchmark's simplicity makes it an excellent tool for developers who need to quickly assess API performance or establish a baseline before moving on to more complex testing scenarios.
8. Locust: Python-Powered Performance Testing for APIs
Locust is an open-source load testing tool that allows developers to write performance tests using Python. Its user-friendly approach and powerful features make it an excellent choice for teams looking to create sophisticated API performance tests with the flexibility of a full programming language.

Key Features of Locust for API Performance Testing
- Python-Based: Write tests using familiar Python syntax.
- Distributed Testing: Scale tests across multiple machines for increased load.
- Real-Time Web UI: Monitor test progress and results in a user-friendly interface.
- Customizable Reporting: Generate detailed reports and export data for analysis.
- Extensibility: Easily extend functionality with Python modules and libraries.
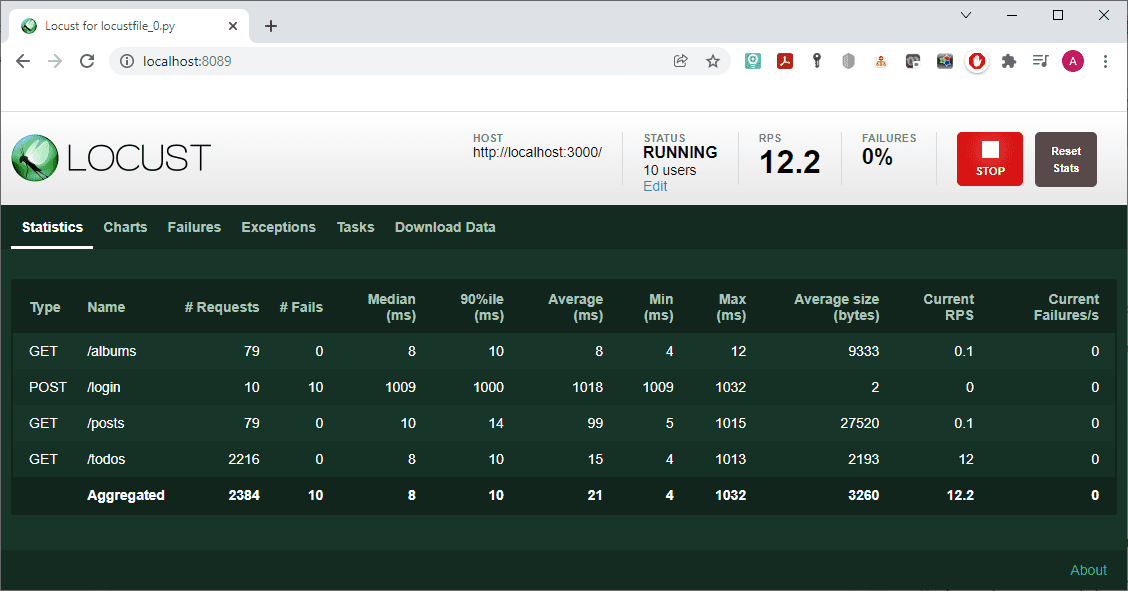
Creating API Performance Tests with Locust
To set up an API performance test using Locust:
- Write a Python script defining your user behavior and API requests.
- Configure test parameters such as user count and spawn rate.
- Run the Locust command to start the test.
- Monitor results in real-time through the web interface.
- Analyze the generated reports to identify performance issues.
Example Locust script for API testing:
from locust import HttpUser, task, between

class APIUser(HttpUser):
    wait_time = between(1, 5)

    @task
    def get_users(self):
        self.client.get("/users")

    @task
    def create_order(self):
        self.client.post("/orders", json={"product_id": 123, "quantity": 1})

    def on_start(self):
        self.client.post("/login", json={"username": "test", "password": "password"})
Locust's Python-based approach allows for highly customizable and complex test scenarios, making it an excellent choice for teams with Python expertise who need to test APIs under realistic and varied conditions.
9. Artillery: Cloud-Native Performance Testing for APIs
Artillery is a modern, powerful, and developer-friendly load testing toolkit designed specifically for testing APIs, microservices, and websites. Its cloud-native approach and extensibility make it an excellent choice for teams working with distributed systems and looking to integrate performance testing into their CI/CD pipelines.

Artillery's Strengths in API Performance Testing
- YAML Configuration: Easy-to-read test scenarios using YAML syntax.
- Plugins Ecosystem: Extend functionality with various plugins for different protocols and integrations.
- Customizable Metrics: Define and track custom metrics relevant to your API.
- Scriptable Scenarios: Use JavaScript to create complex, dynamic test scenarios.
- Cloud Integration: Seamlessly run tests on AWS, Azure, or GCP.
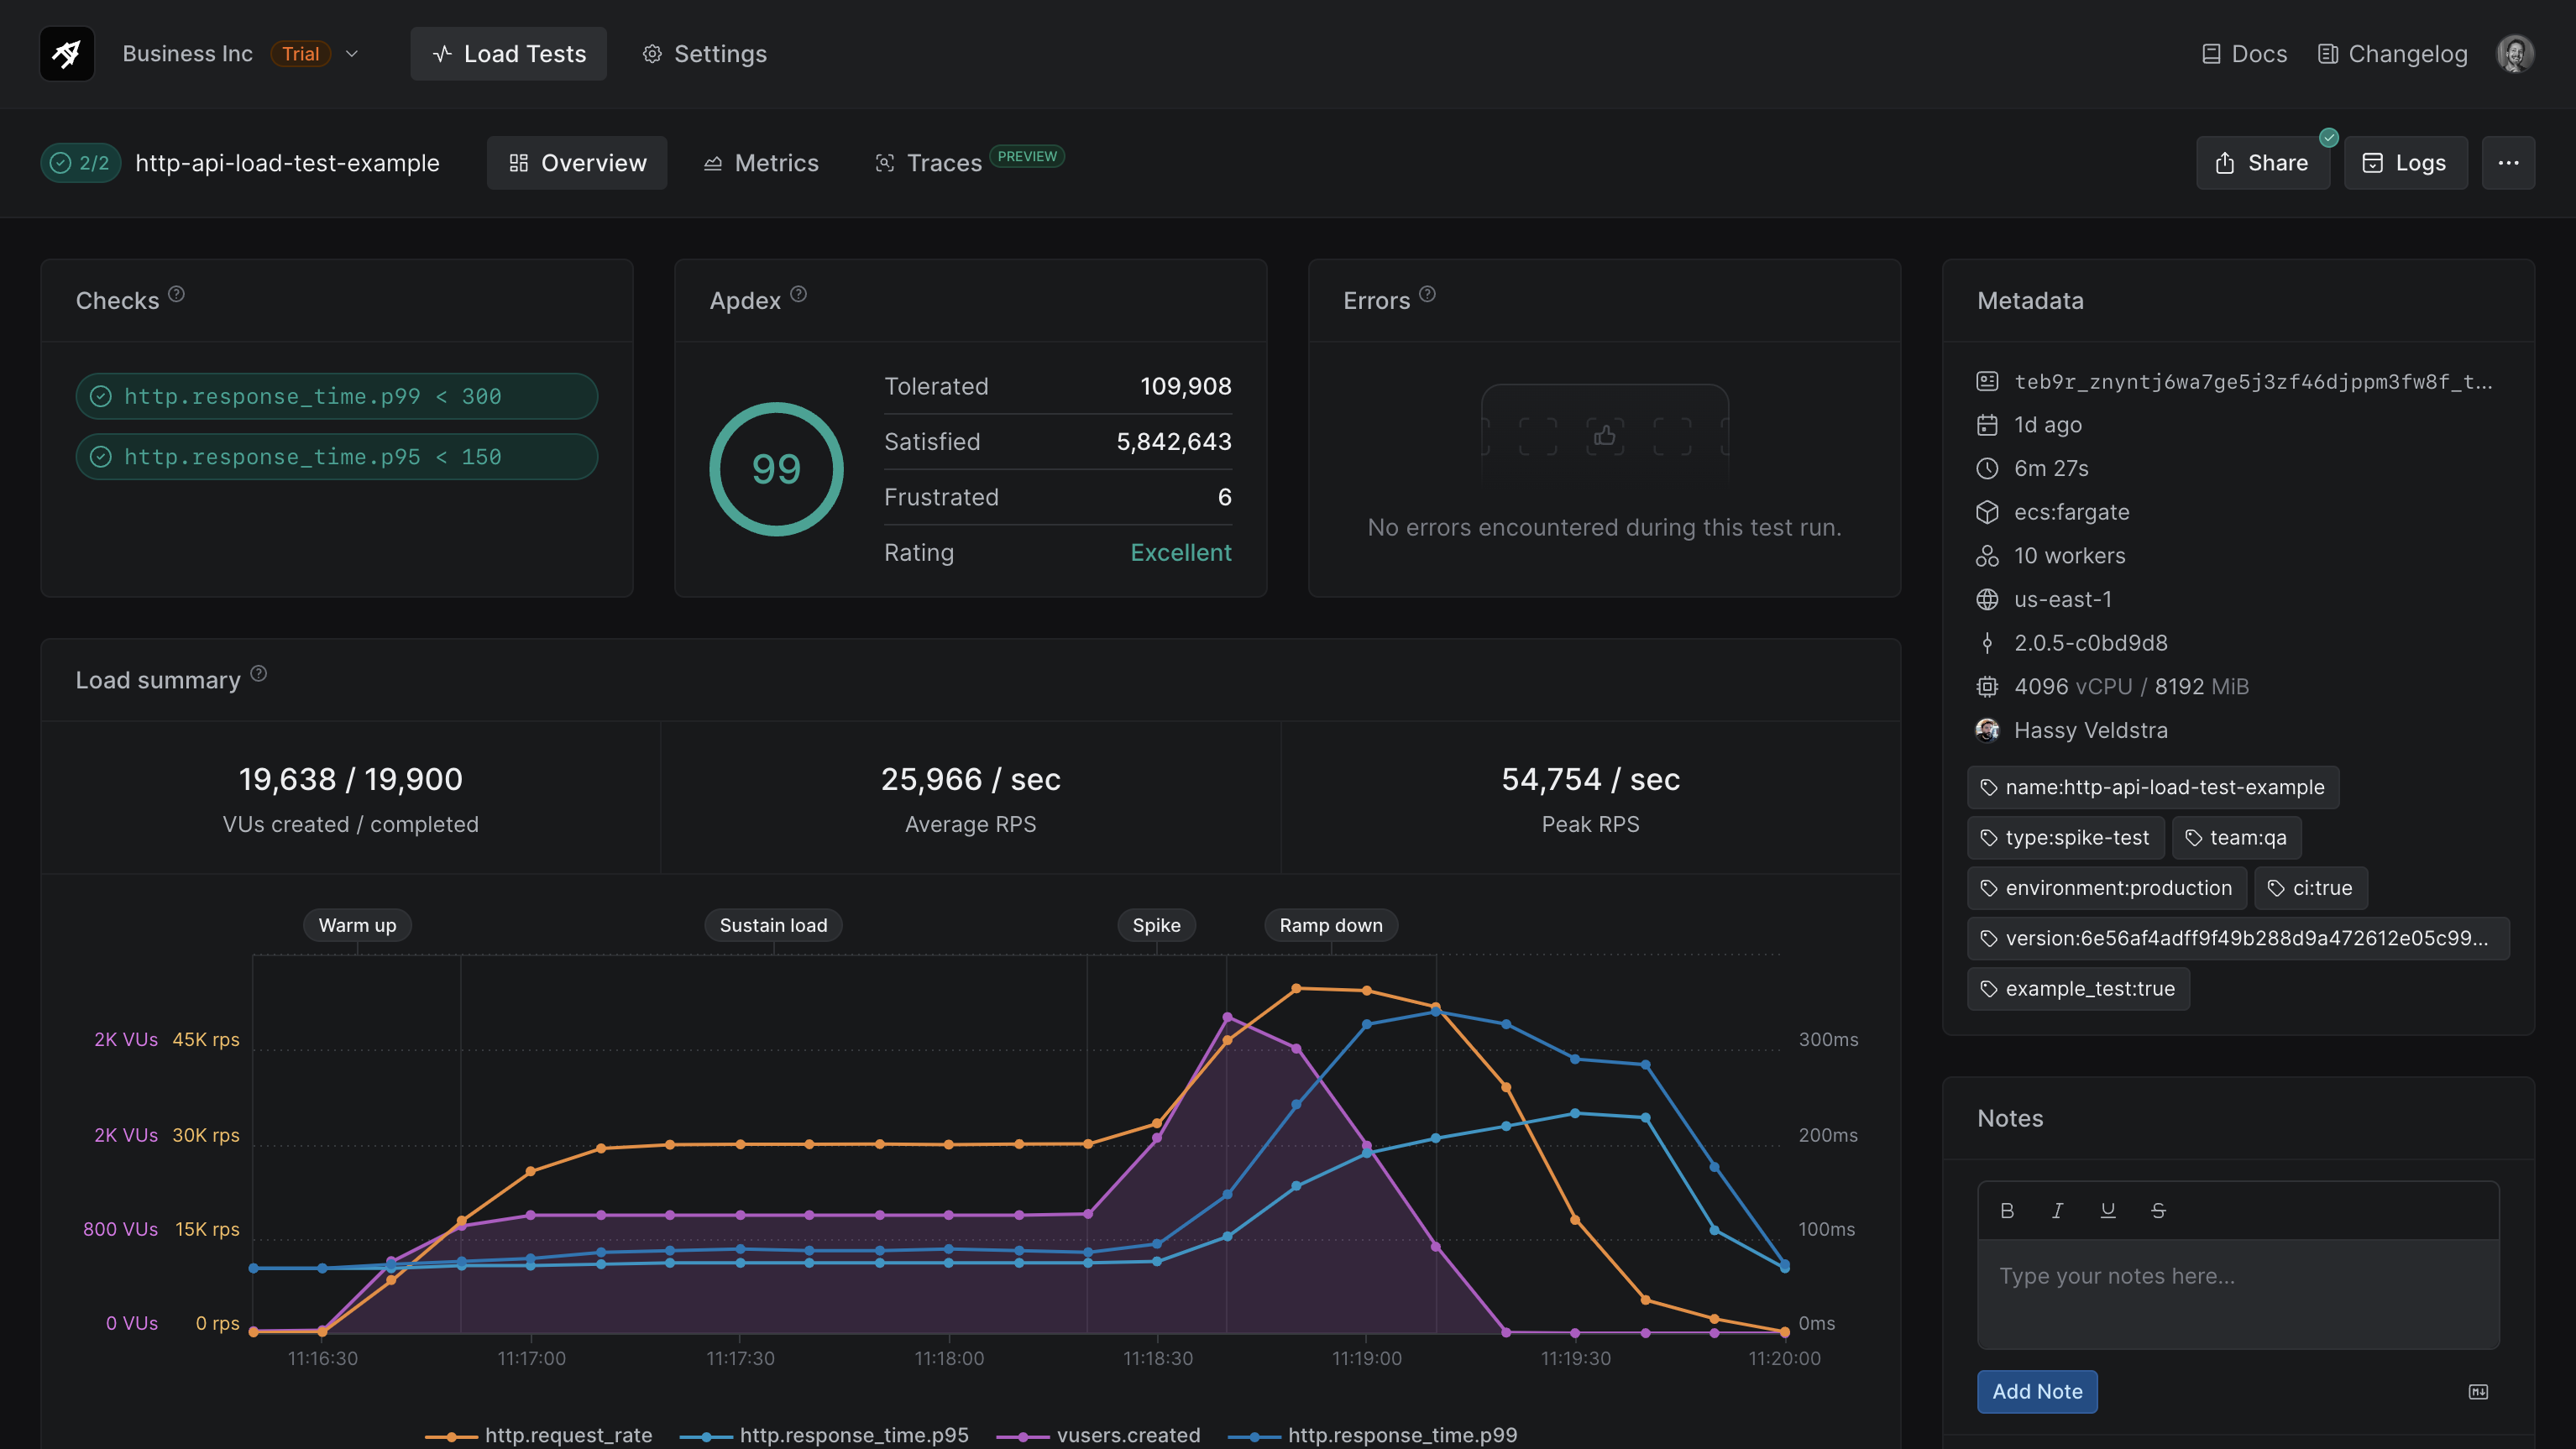
Implementing API Performance Tests with Artillery
To create an API performance test using Artillery:
- Define your test scenario in a YAML file.
- Specify endpoints, request rates, and test duration.
- Add custom functions or plugins if needed.
- Run the test using the Artillery CLI.
- Analyze the generated report for performance insights.
Example Artillery test configuration:
config:
  target: "https://api.example.com"
  phases:
    - duration: 60
      arrivalRate: 5
      rampTo: 50
  defaults:
    headers:
      Content-Type: "application/json"

scenarios:
  - name: "API Test"
    flow:
      - get:
          url: "/users"
      - think: 1
      - post:
          url: "/orders"
          json:
            productId: 123
            quantity: 1
Artillery's focus on cloud-native testing and its flexible configuration options make it an ideal tool for modern development teams working with distributed systems and microservices architectures.
10. Vegeta: HTTP Load Testing Tool and Library
Vegeta is a versatile HTTP load testing tool and library, known for its simplicity and powerful command-line interface. It's particularly well-suited for API performance testing due to its ability to maintain a constant request rate, which is crucial for accurately simulating real-world API traffic patterns.
Vegeta's Advantages for API Performance Testing
- Constant Rate Load: Accurately simulate steady API traffic.
- Flexible Input Formats: Support for various input methods including HTTP requests file.
- Detailed Metrics: Provides comprehensive statistics on latency, throughput, and status codes.
- Plotting Capabilities: Generate plots for visual analysis of test results.
- Library Mode: Can be used as a Go library for custom test implementations.
Conducting API Performance Tests with Vegeta
To perform an API performance test using Vegeta:
- Create a targets file or use the command-line to specify API endpoints.
- Set the desired request rate and duration.
- Run the test using the Vegeta CLI.
- Analyze the results using Vegeta's report and plot commands.
Example Vegeta command for API testing:
echo "GET https://api.example.com/users" | vegeta attack -rate=50 -duration=30s | vegeta reportThis command sends 50 requests per second for 30 seconds to the specified API endpoint and generates a report.Vegeta's focus on maintaining a constant request rate and its detailed reporting make it an excellent choice for teams looking to conduct precise and reproducible API performance tests.
Conclusion: Choosing the Right Tools for API Performance Testing at Scale
As we've explored the top 10 techniques and tools for performance testing APIs at scale, it's clear that each option offers unique strengths and capabilities. The choice of tool often depends on specific project requirements, team expertise, and the nature of the APIs being tested.
Key Considerations When Selecting API Performance Testing Tools
- Scalability: Ensure the tool can generate the required load to test your API at scale.
- Ease of Use: Consider the learning curve and how well it fits with your team's skills.
- Integration: Look for tools that integrate well with your existing development and CI/CD processes.
- Reporting: Evaluate the depth and clarity of performance reports and analytics.
- Cost: Factor in both the financial cost and the time investment required to implement and maintain the testing solution.
The Future of API Performance Testing
As APIs continue to play a crucial role in modern software architecture, the importance of performance testing at scale will only grow. Emerging trends such as AI-assisted test generation, real-time performance monitoring, and integration with observability platforms are likely to shape the future of API performance testing tools. By leveraging these powerful tools and techniques, development teams can ensure their APIs are robust, scalable, and capable of delivering exceptional performance even under the most demanding conditions. Remember, effective API performance testing is not a one-time activity but an ongoing process of optimization and improvement, crucial for maintaining the quality and reliability of your digital services.


