Performance and stability are paramount when building and maintaining APIs. API performance directly impacts user experience and system availability, making comprehensive performance testing essential.

What is API Performance Testing?
API performance testing typically involves simulating real user behavior, stress testing, and load testing to evaluate system stability and performance metrics.
Before conducting performance testing, it's recommended to perform functional testing on the API to ensure all APIs function correctly as expected. Functional testing helps identify and rectify functional issues, while performance testing focuses on evaluating API behavior under high load. Only functionally sound APIs yield meaningful performance test results, providing a reliable basis for further performance optimization.
How to Do Performance Testing in Apidog?
This guide will walk you through leveraging Apidog's "Performance Test" feature to assess your API's performance.
Step 1: Orchestrating Performance Test Scenarios
Before initiating performance testing, you need to create test cases. You can import these from existing APIs or API use cases, or define custom requests. Once the test steps are ready, executing a functional test is advisable to ensure the API operates as expected before proceeding with performance testing.

Step 2: Configuring Performance Test Settings
In the "Tests" section of Apidog, you'll find a dedicated module for "Performance (Beta)." Here, you can configure various settings to prepare for the upcoming performance test.
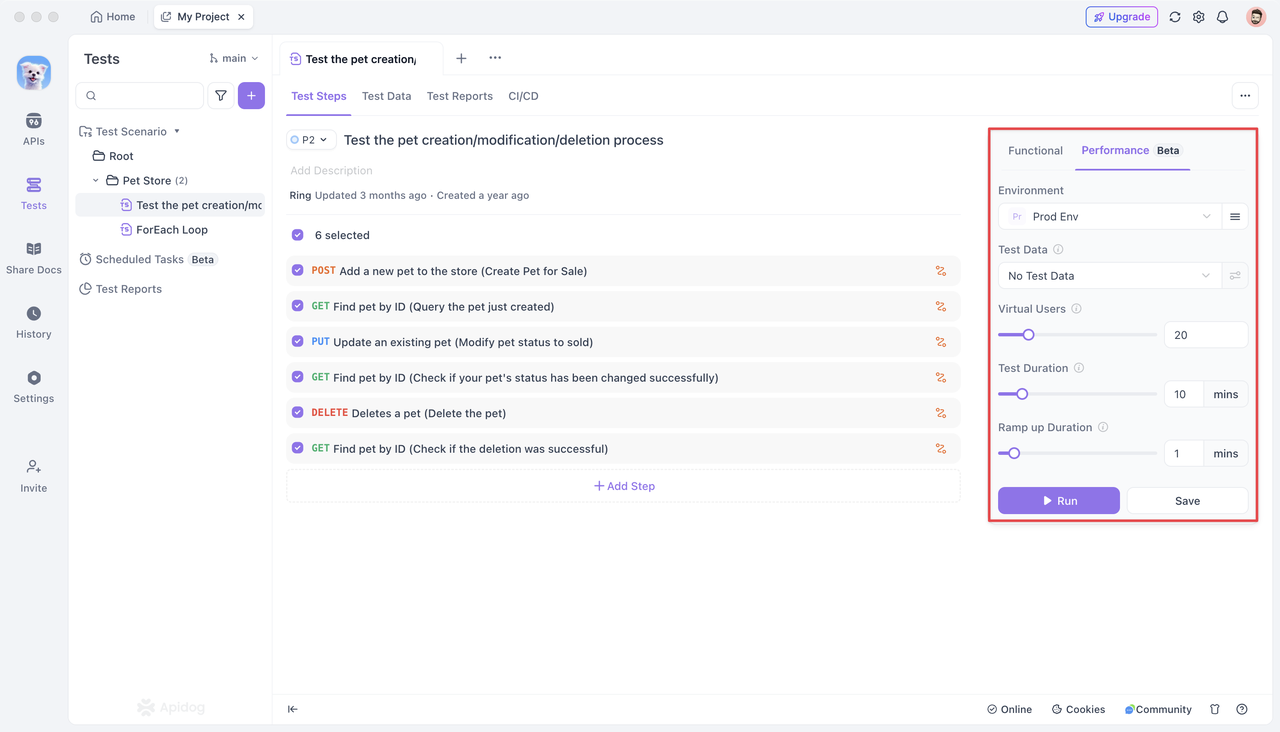
Configuration Options:
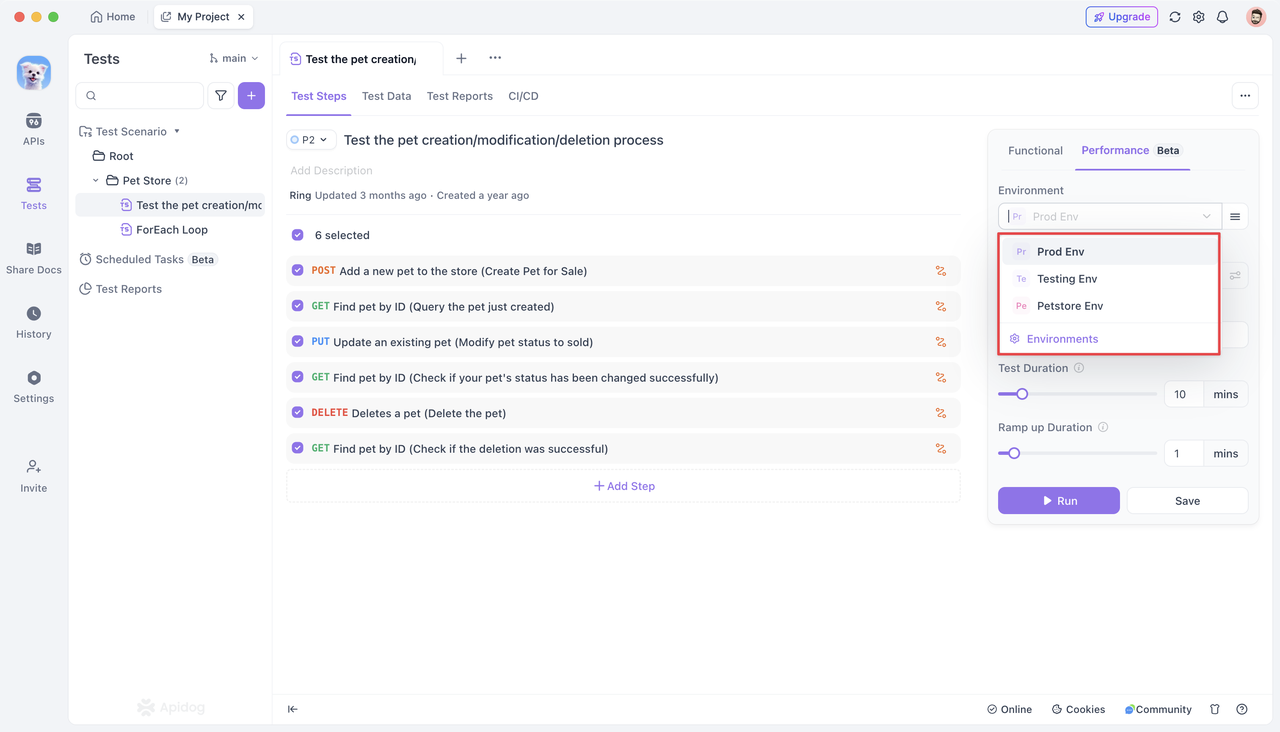
Specify the backend service environment for requests during the "Performance Test." By default, the environment configuration set for the current project is automatically applied.
Test data refers to the dataset used to initiate requests during performance testing. Using test data allows each concurrent user to make requests with different parameters, better simulating real-world traffic.
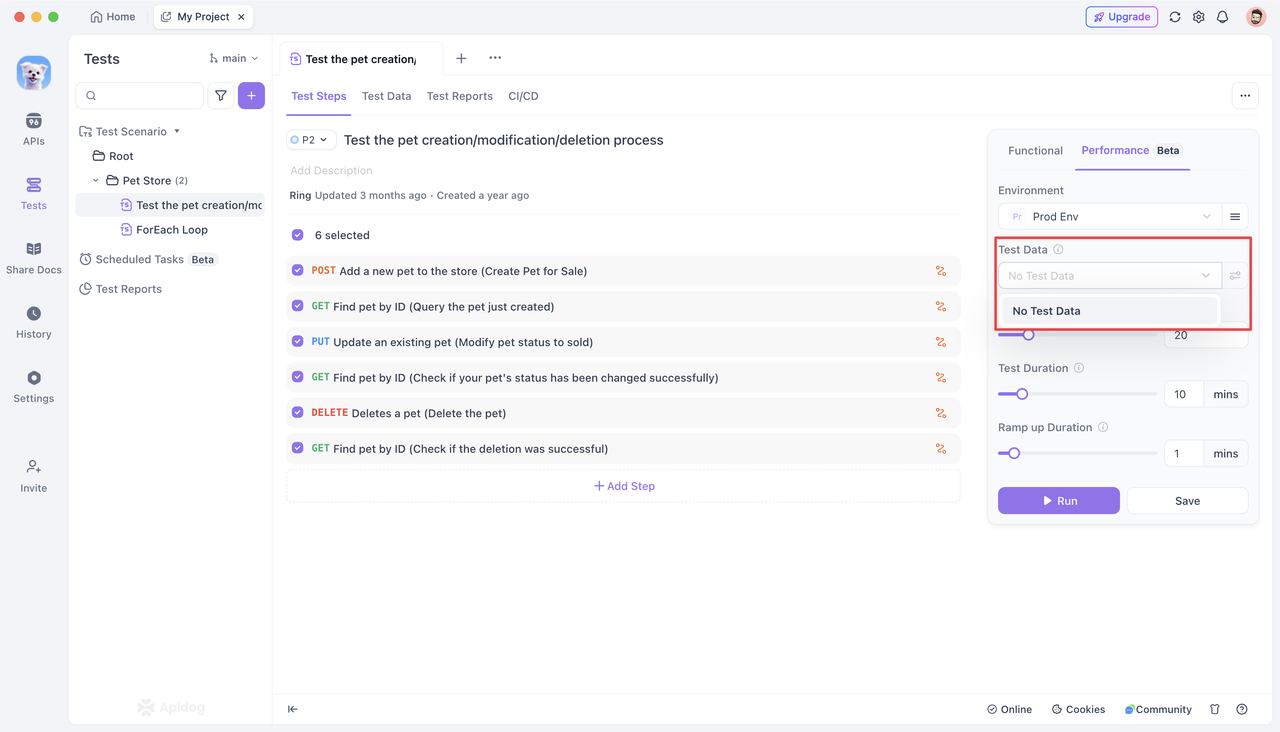
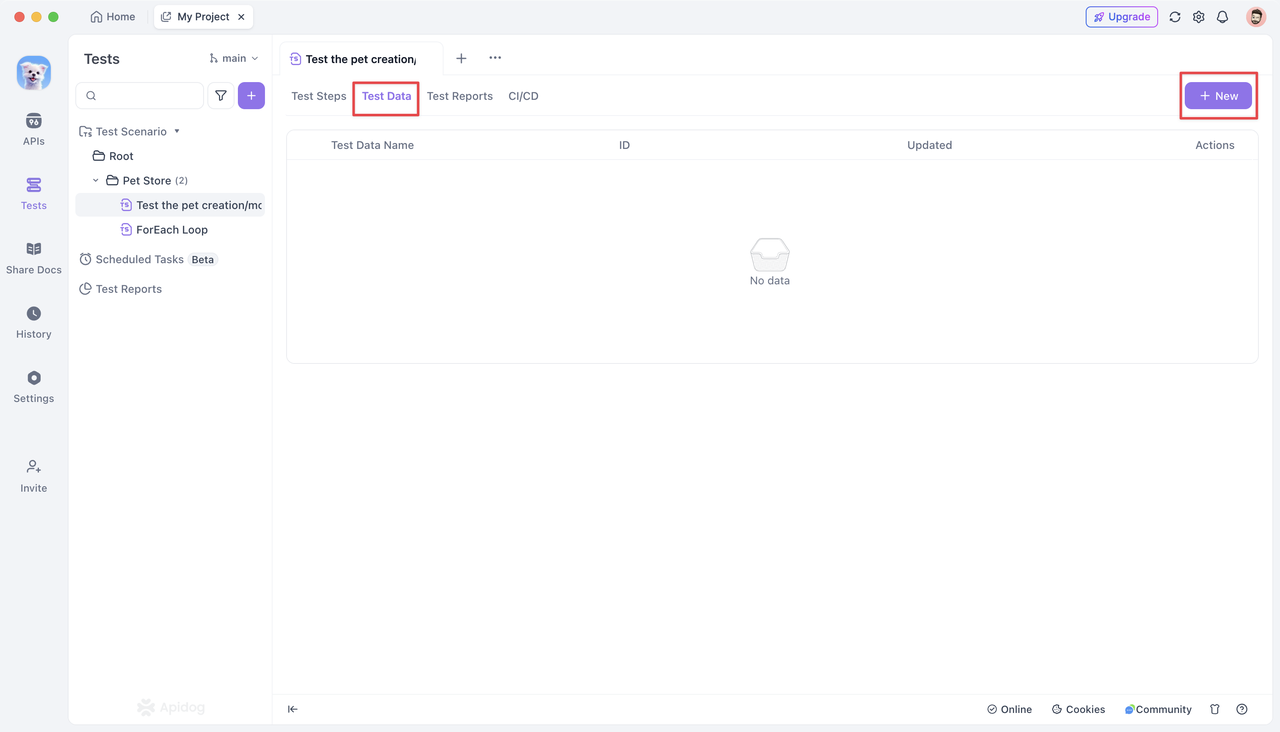
- To use test data, click the "Test Data" tab and create a new dataset.
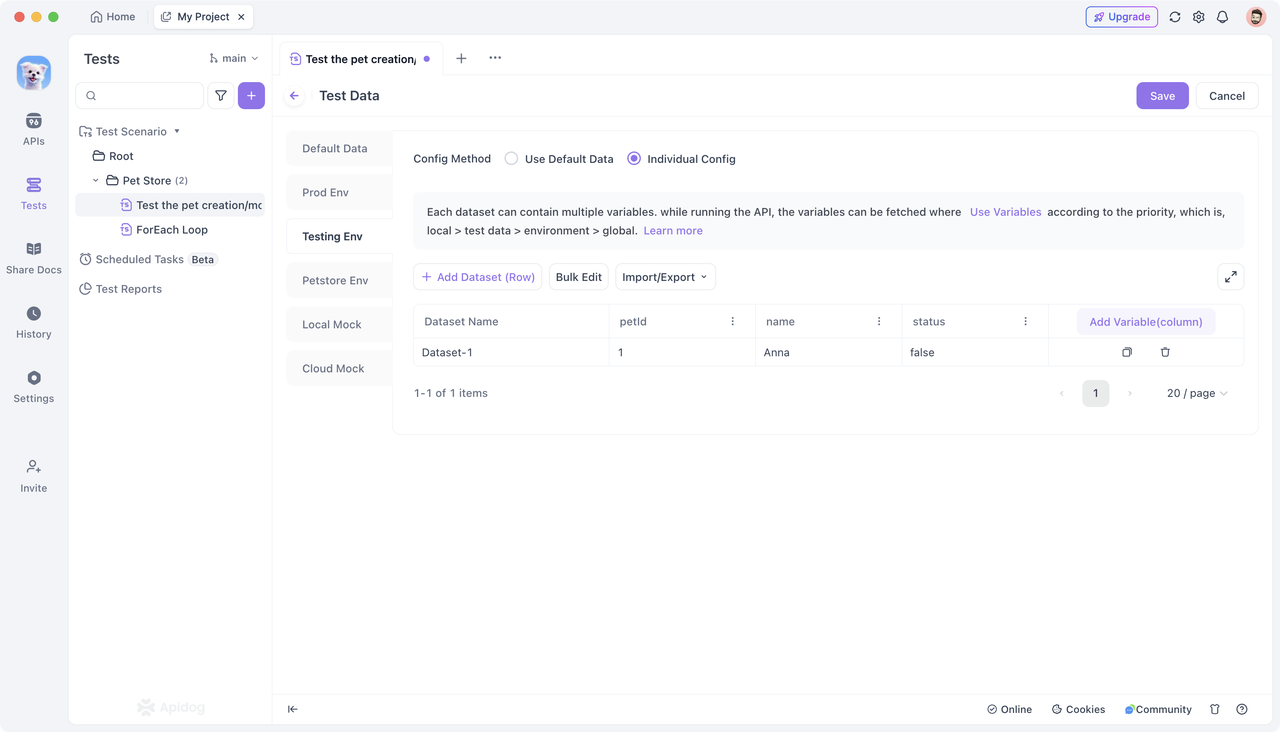
- Configure the dataset for the corresponding environment. You can add data manually or import it in JSON or CSV format. Save the dataset after editing.
- In the test step details page, associate variables with the test data.
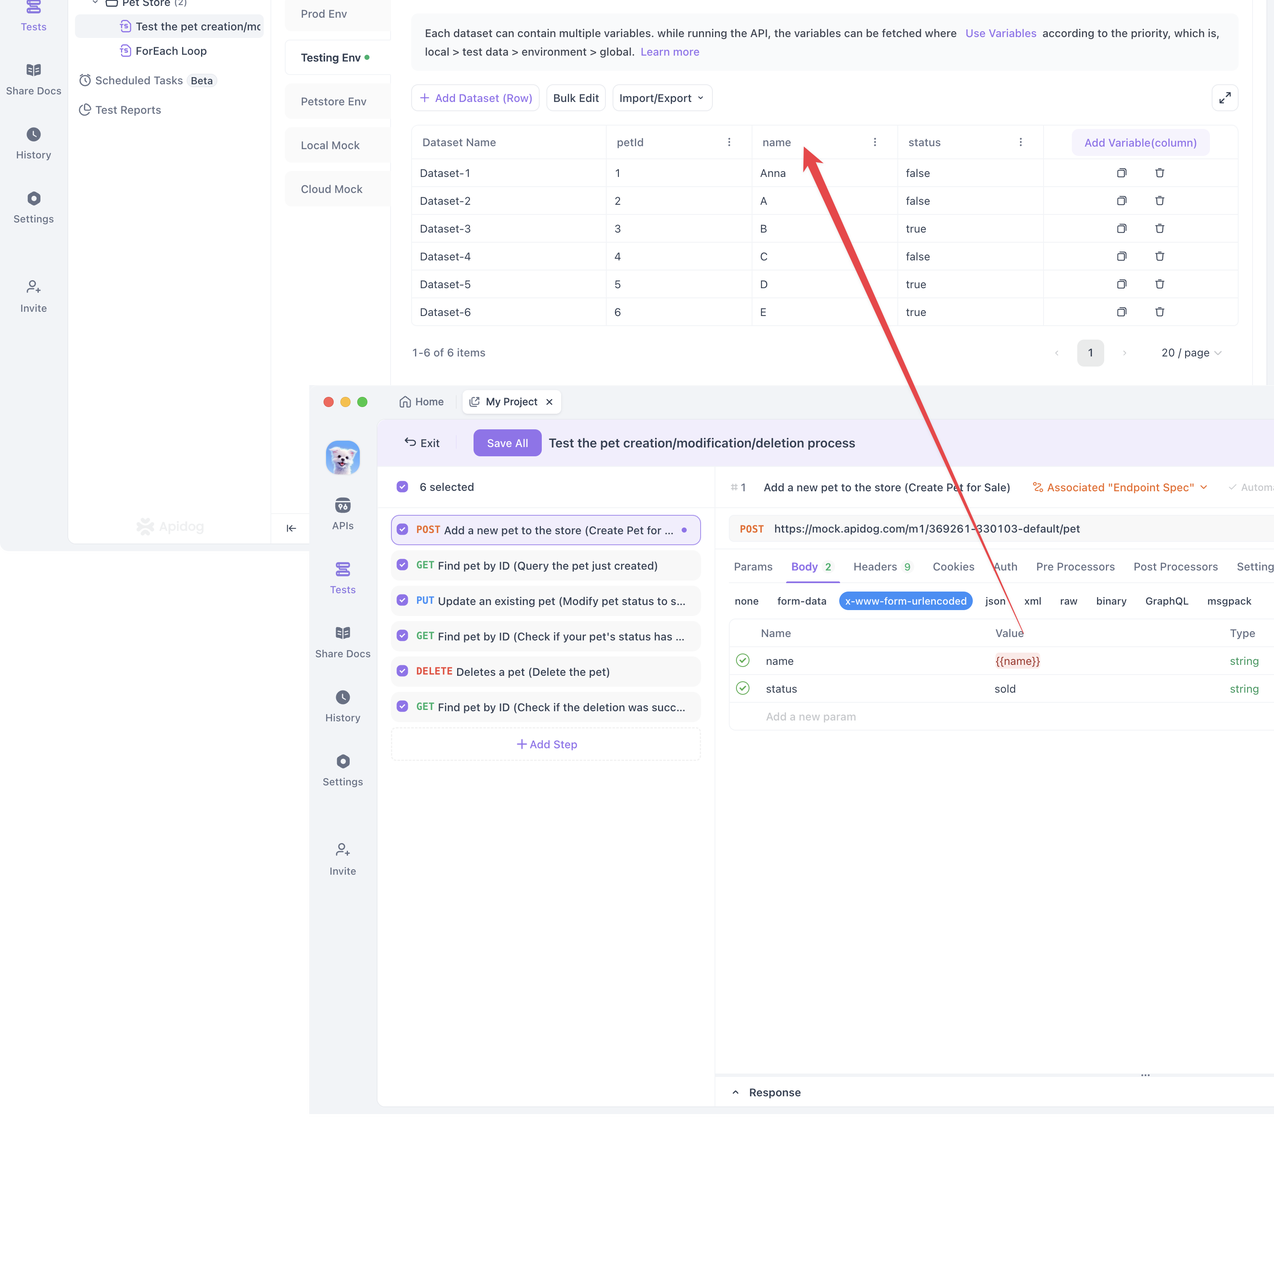
- When you choose to associate test data in a performance test, concurrent users will use the variables defined in the test data to make requests. You can choose between "Randomized" and "Ordered" modes for testing.
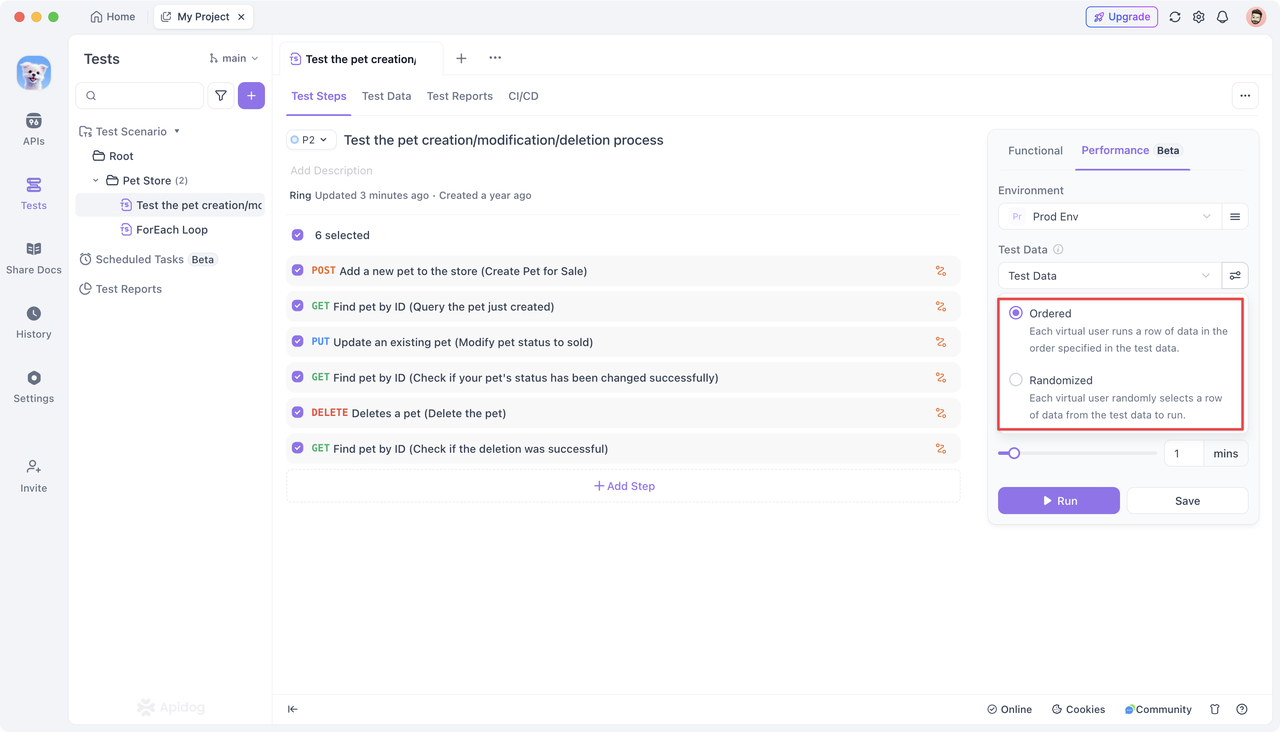
Each concurrent user randomly selects a row of data from the test data. This ensures that each user gets unique data, guaranteeing broad coverage in the performance test.
Ordered Match:
Each concurrent user selects the next row of data in sequence from the test data. Note that if the number of concurrent users exceeds the number of rows in the test data, the exceeding users will not participate in the test. Ensure you have sufficient test data to support all concurrent users in this mode.
- Concurrent Users (Virtual Users):
Performance testing currently supports simulating up to 100 concurrent users. These users will concurrently simulate real online user behavior within the specified test duration, repeatedly executing the test scenario. This effectively simulates high-concurrency scenarios to evaluate the API's performance and stability under a large number of user requests.
- Running Time:
Defines the total duration of the performance test. Each concurrent user will continuously loop through all API requests defined in the test scenario within this set time. Currently, the maximum test duration supported is 60 minutes.
- Ramp-Up Time:
In some cases, a large number of users do not access the service instantaneously but rather gradually increase over time.
Ramp-up time simulates the gradual increase in user traffic. Instead of using all concurrent users immediately at the start of the test, the number of users linearly increases over a set time (X minutes) until it reaches the total number of concurrent users. Setting X to 0 means that all concurrent users will be enabled for stress testing from the beginning.
After configuring the above options, save the settings and click the "Run" button to start the performance test.
Step 3: Running the Performance Test
Clicking "Run" initiates the performance test. Apidog's performance test originates from the user's computer (not the Apidog server) and utilizes the computer's hardware resources to execute the configured test steps, test data, and concurrent requests.
Therefore, you need to consider your computer's performance and the behavior of other APIs to determine whether the performance issue lies with the API being tested or the computer initiating the test. If you find that the number of requests initiated does not increase regardless of the server or API, you may need a more powerful computer to conduct the performance test.
Once the performance test starts, Apidog provides an intuitive visualization panel to monitor and display key real-time performance indicators. This includes the total number of requests for each API, requests per second, average response time, maximum/minimum response time, and request failure rate.

Understanding Performance Metrics:
The visualization panel presents comprehensive data for the entire test scenario and individual API data.
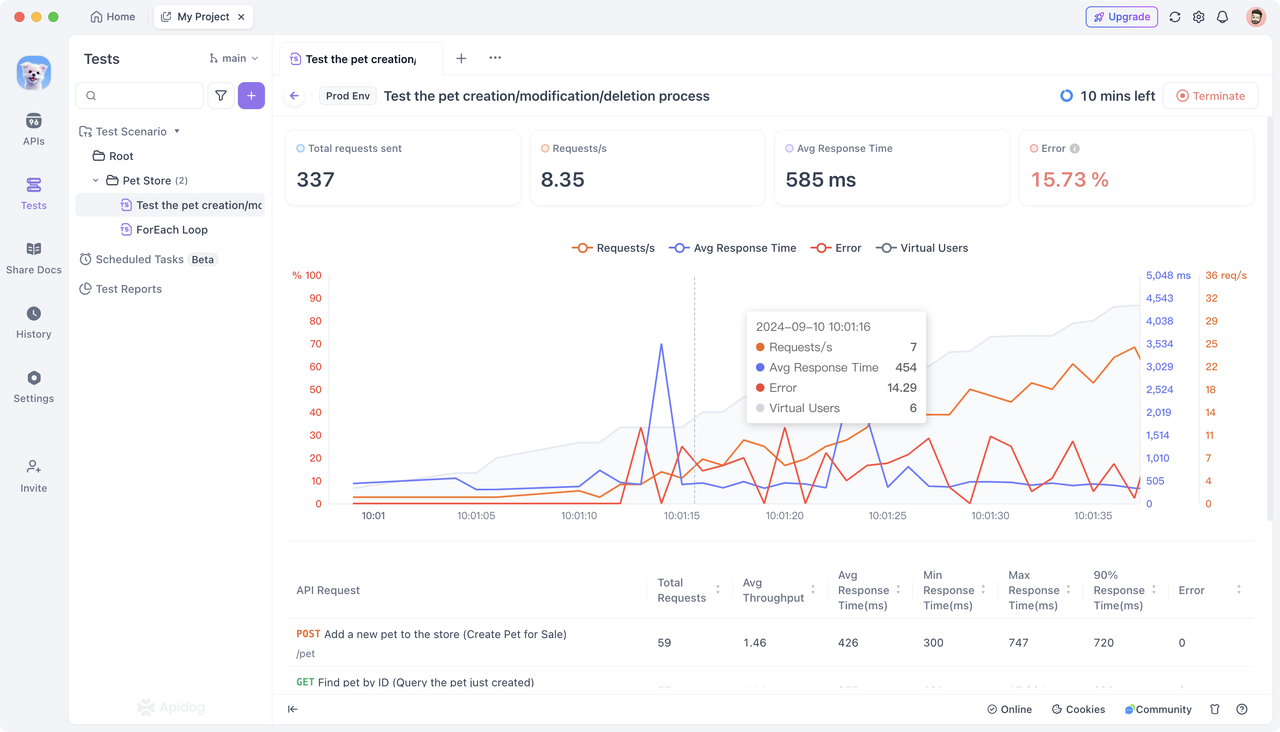
Comprehensive Data:
- Total Requests: Reflects the total number of requests processed by the API during the test. A high number of total requests is reasonable in large-scale user scenarios, but ensure the API can handle these requests effectively.
- Requests per Second: A high number indicates the API can process a large volume of requests in a short time, signifying good performance. A low number might suggest a performance bottleneck.
- Average Response Time: A low average response time generally indicates users receive feedback quickly, reflecting excellent API performance. A high response time suggests slow responses, potentially impacting user experience.
- Request Failure Rate: Indeed, the failure rate should be close to zero. A high failure rate indicates the API cannot handle requests properly in certain situations, requiring further error analysis and optimization.
- Concurrent Users: Setting an appropriate number of concurrent users helps simulate real-world user load. However, setting it too high can overload the system, leading to performance degradation.
Individual API Data:
- Total Requests: Total requests sent for a single API.
- Requests per Second: Average number of requests sent per second for a single API.
- Average Response Time (ms): Average response time for all requests to a single API.
- Minimum Response Time (ms): Shortest response time among all requests to a single API.
- Maximum Response Time (ms): Longest response time among all requests to a single API.
- 90% Response Time: Response time for the 90th percentile of requests to a single API.
- Failure Rate: Percentage of failed requests for a single API.
Analyzing Test Results:
- Visualizations:
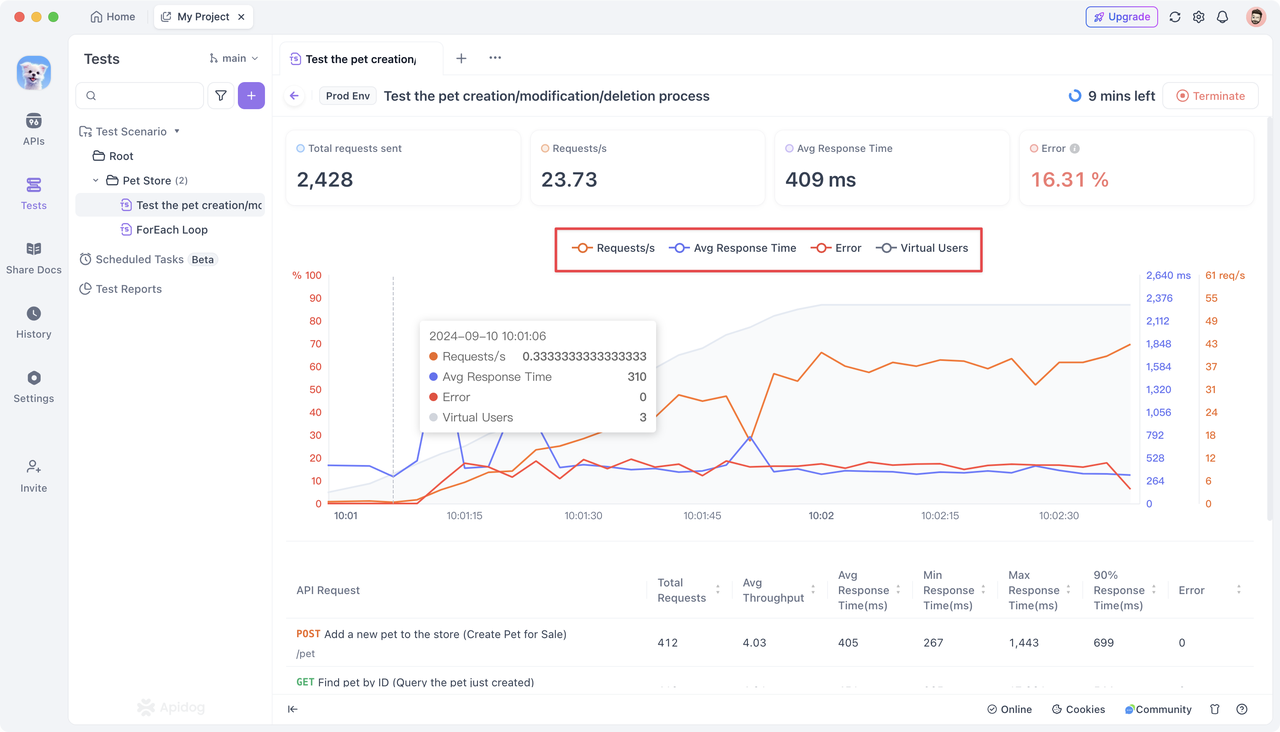
Different curve colors on the visualization panel correspond to different performance metrics on the vertical axis. The horizontal axis represents the duration of the performance test. The vertical axis displays metrics such as request failure rate, average response time, and requests per second (concurrent users are hidden by default). You can click on a specific metric to highlight or hide it for focused analysis.
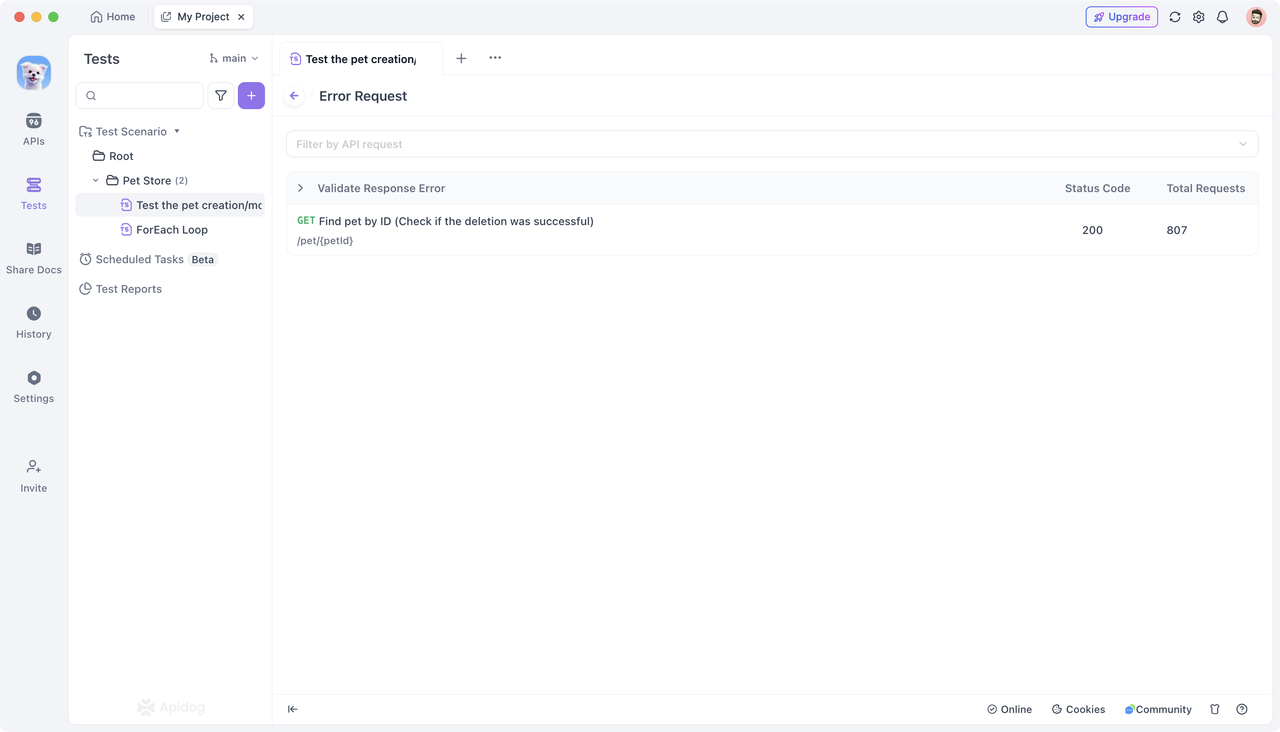
- Filtering and Details:
To examine specific failed requests, click on "Validate Response Error." You can also use the filtering functionality to focus on the performance of specific APIs.
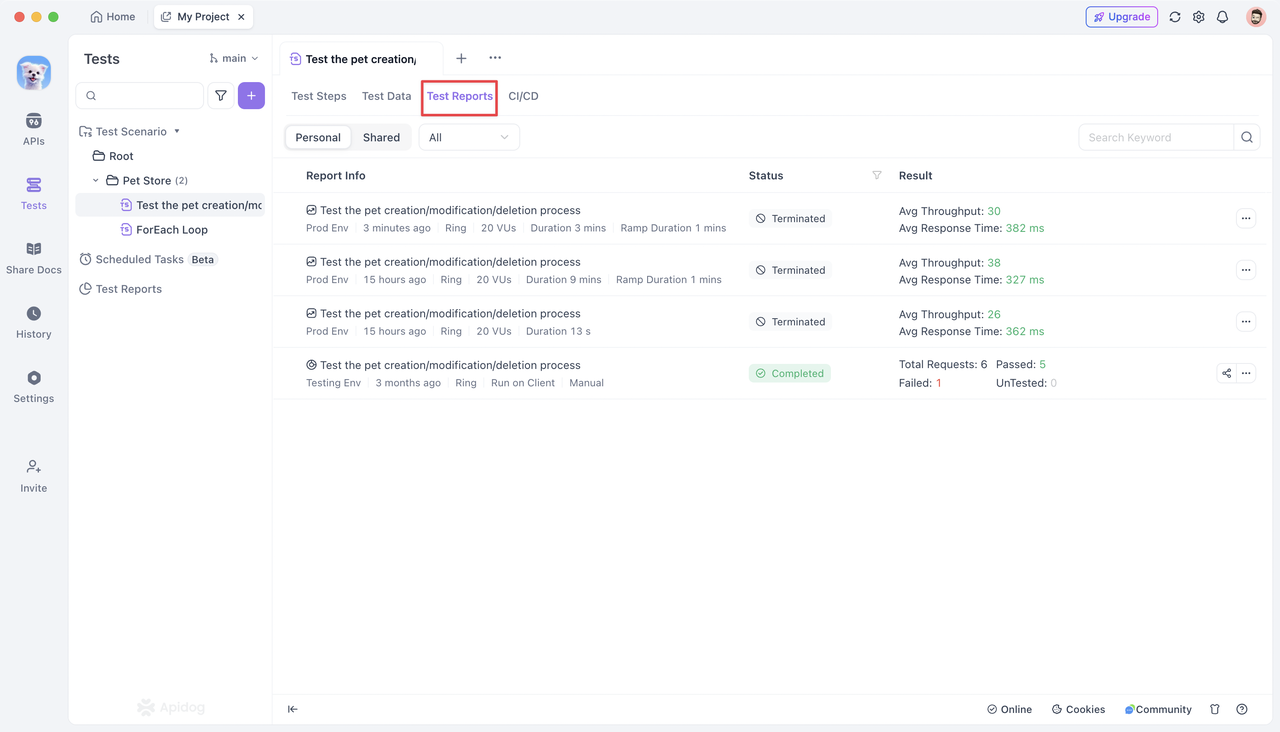
- Test Reports:
After the performance test, click the "Test Reports" tab to view all historical reports for the test scenario. These reports detail the "Configuration Options" set before executing the performance test.
You can filter reports by type (functional test, performance test). Clicking on a test report takes you to its details page, displaying the same metrics collected during the performance test.
Note: Only one performance test can be executed per project at a time. Click the "Terminate" button in the top right corner to stop the current test if a higher-priority test needs to be run.

Conclusion
Apidog provides a user-friendly solution for API performance testing, simplifying the process of setting test parameters, executing tests, and viewing results. With detailed performance metrics and a clear visualization panel, you can comprehensively understand your API's performance.