Debugging is one of the most time-consuming parts of software development, especially when bugs hide deep inside large codebases or across async flows. Fortunately, OpenAI Codex is more than a code generator: it’s a powerful assistant that helps you find, diagnose, and fix bugs faster using context-aware analysis, REPL-style execution, and pattern detection. In this technical guide, we’ll walk through practical techniques for using Codex to debug code, from simple error explanations to iterative fix-verify workflows.
You’ll learn how to use the Codex CLI, leverage tools like Code Interpreter, and apply advanced search and context strategies that integrate smoothly with your development processes.
Why Use Codex for Debugging?
Traditional debugging involves:
- Reading stack traces
- Tracking variables
- Stepping through the code in a debugger
- Guessing root causes and verifying fixes
Using Codex to debug code accelerates this by combining:
- Context understanding: The model reads multiple files and infers relationships and patterns
- Automated tracing: It can reproduce errors and suggest targeted fixes
- Stateful execution: When paired with Code Interpreter, Codex runs code in a sandbox to validate behavior and verify fixes
- Iteration: You can refine tests and apply fixes dynamically
This turns debugging into a collaborative loop between you and the model—speeding up error discovery and resolution while maintaining confidence.
Setting Up Codex for Debugging
Before you start, ensure you have:
- Codex CLI or IDE extension installed
- Codex authenticated under a ChatGPT plan (Plus, Pro, Business, Enterprise) or with an API key
- The target codebase accessible in your working directory
Installing the CLI
npm install -g @openai/codex
Authenticate:
codex login
Or set an API key in your environment:
export OPENAI_API_KEY="sk-xxx"
This ensures your debug sessions use your chosen plan’s quotas and capabilities.
Basic Error Explanation Using Codex
When you hit a runtime error, the first step is diagnosing it. Codex can parse the error message and point to root causes with contextual analysis.
Terminal Example
codex
> Explain this error: TypeError: undefined is not a function in user.js line 42
Codex will produce a structured explanation including:
- Likely cause(s)
- Relevant variables or functions involved
- Suggested correction
- Code snippet with a fix
This is especially useful for errors that are cryptic or buried deep inside callbacks, async handlers, or inherited classes.
Using Code Interpreter for REPL-Style Debugging
One of Codex’s strongest tools for debugging is Code Interpreter—a stateful sandbox environment where Codex can execute snippets, reproduce failures, and validate fixes.
Scenario: You have a Python function throwing a KeyError.
Prompt in CLI
codex
> Debug this Python function; it's throwing KeyError
Codex will load the snippet, execute it, display the traceback, and suggest fixes such as:
- Wrapping dictionary access in safe checks
- Using
dict.getwith defaults - Adding graceful error handling
Because Code Interpreter runs code dynamically, it can test these suggestions on the spot and confirm whether the error disappears.
Codex File Search and Retrieval for Multi-File Bugs
In larger repos, bugs rarely live in a single file. Codex supports semantic file search and retrieval, helping you find all relevant references across a codebase.
Consider the prompt:
codex
> Find where the auth token is set in this project
Codex will query a vector-indexed repository and return:
- Matching file paths
- Specific lines with context
- A summary explaining their relevance
This tool is invaluable when debugging issues that span modules, such as auth flows, global state leaks, or config inconsistencies.
Iterative Fix and Validate Loop
Debugging isn’t a single step; it’s a loop:
- Describe the bug to Codex
- Let Codex propose a fix
- Verify the fix in Code Interpreter
- Refine based on edge cases
Example CLI Session
codex
> Debug this test failure for calculateTotal
> Now test with edge case: negative price
Codex will:
- Suggest root causes related to overflow or missing validations
- Propose updated code
- Execute updated tests in the sandbox
- Report results and remaining errors
This loop reduces manual investigation time and lets you focus on business logic.
Documenting and Explaining Debug Fixes
A well-debugged codebase should also be well-documented. After fixing a bug, prompt Codex to generate or update documentation:
codex
> Generate docstrings and README updates explaining this fix
Codex writes:
- Inline docstrings
- Summary paragraphs for README or CHANGELOG
- JSDoc or Sphinx comments explaining the issue and resolution
This step ensures future developers understand both the bug and the reasoning behind the solution—especially in team environments where context hand-off is key.
Debugging API Code with Codex
API endpoints have unique challenges: status codes, validation, auth, race conditions, and edge cases. Codex helps by:
- Running sanity checks on inputs
- Generating comprehensive tests
- Validating error flows (e.g., 401, 403, 500)
- Simulating loads
Example prompt:
codex
> Generate pytest cases for /login covering 200, 400, 401, and 500
Codex will produce tests with fixtures, mocks, and assertions for each scenario. You can execute these in Code Interpreter or integrate them into your CI suites.
Prompt Engineering Tips for Better Debugging
Optimizing how you frame your queries increases accuracy and relevance:
1. Provide Code Context: Include the smallest reproducible snippet around a bug. Avoid huge blobs that dilute focus.
2. Specify Environment: Tell Codex the language, framework, and version—e.g., Rust 1.73, Node 20, Django 4.2. This reduces false assumptions.
3. Include Error Outputs: Always paste the full runtime error message or log trace; context matters.
4. Use Step-By-Step Refinement: Break complex bugs into subtasks: “Locate error source,” then “Propose fix,” then “Verify edge cases.”
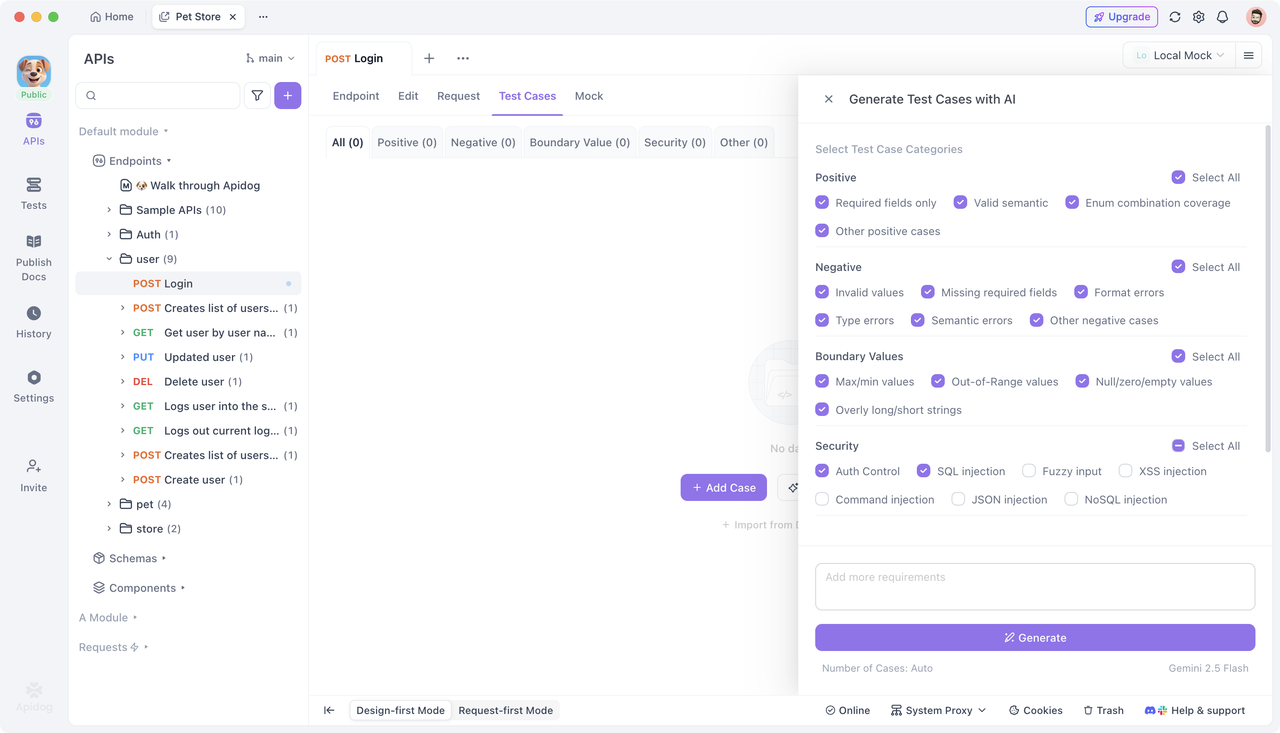
Using Apidog in API Debug Workflows
While Codex excels at finding and fixing bugs, API endpoints often require runtime contract validation and behavior testing. This is where Apidog naturally complements your flow.
Apidog offers:
- API testing automation
- Test case generation for endpoints
- API contract checks that detect breaking changes
Unlike unit debugging, which targets logic, Apidog verifies that your APIs behave as expected under real client interactions.
You can start using Apidog for free to ensure your bug fixes don’t introduce regressions into API behavior.
Frequently Asked Questions
Q1. Do I need a paid plan to debug with Codex?
Yes—full debugging capabilities, especially Code Interpreter and gpt-5-codex, require a paid OpenAI plan like ChatGPT Pro or Business. Free tiers have limited access (e.g., restricted models or query counts).
Q2. Can Codex fix bugs automatically?
Codex proposes fixes, but you should always review and test them locally or via CI before merging.
Q3. How does Codex use context in debug sessions?
Codex incorporates code around the bug plus related files via file search and retrieval tools, giving it a more holistic view than isolated snippets.
Q4. Can Codex handle large codebases?
Yes—semantic search and retrieval let Codex bring relevant parts of a large codebase into context, even across hundreds of files.
Q5. What languages does Codex debug?
Codex supports major languages (Python, JavaScript, TypeScript, Go, Rust, etc.)—as long as the prompt includes sufficient context.
Conclusion
Using Codex to debug code shifts the paradigm from manual detective work to intelligent, iterative problem solving. By combining contextual analysis, REPL-like execution, semantic search, and automated documentation, Codex accelerates your debug cycles while keeping you in control.
For API-centric systems, supplement this workflow with Apidog to generate and validate endpoint tests and contracts, ensuring your fixes behave correctly in production.
Start debugging smarter with Codex—and combine it with Apidog’s free tools for bulletproof API behavior.