
In the world of performance testing, throughput is one of the most critical yet frequently misunderstood metrics. As performance engineers and QA professionals, having a clear understanding of throughput is essential for accurately measuring application performance and identifying potential bottlenecks. This comprehensive technical article will explore what throughput is, how it's measured, and why it matters in performance testing scenarios.
Before diving into throughput metrics, it's worth noting that effective performance testing often begins with robust API testing capabilities.
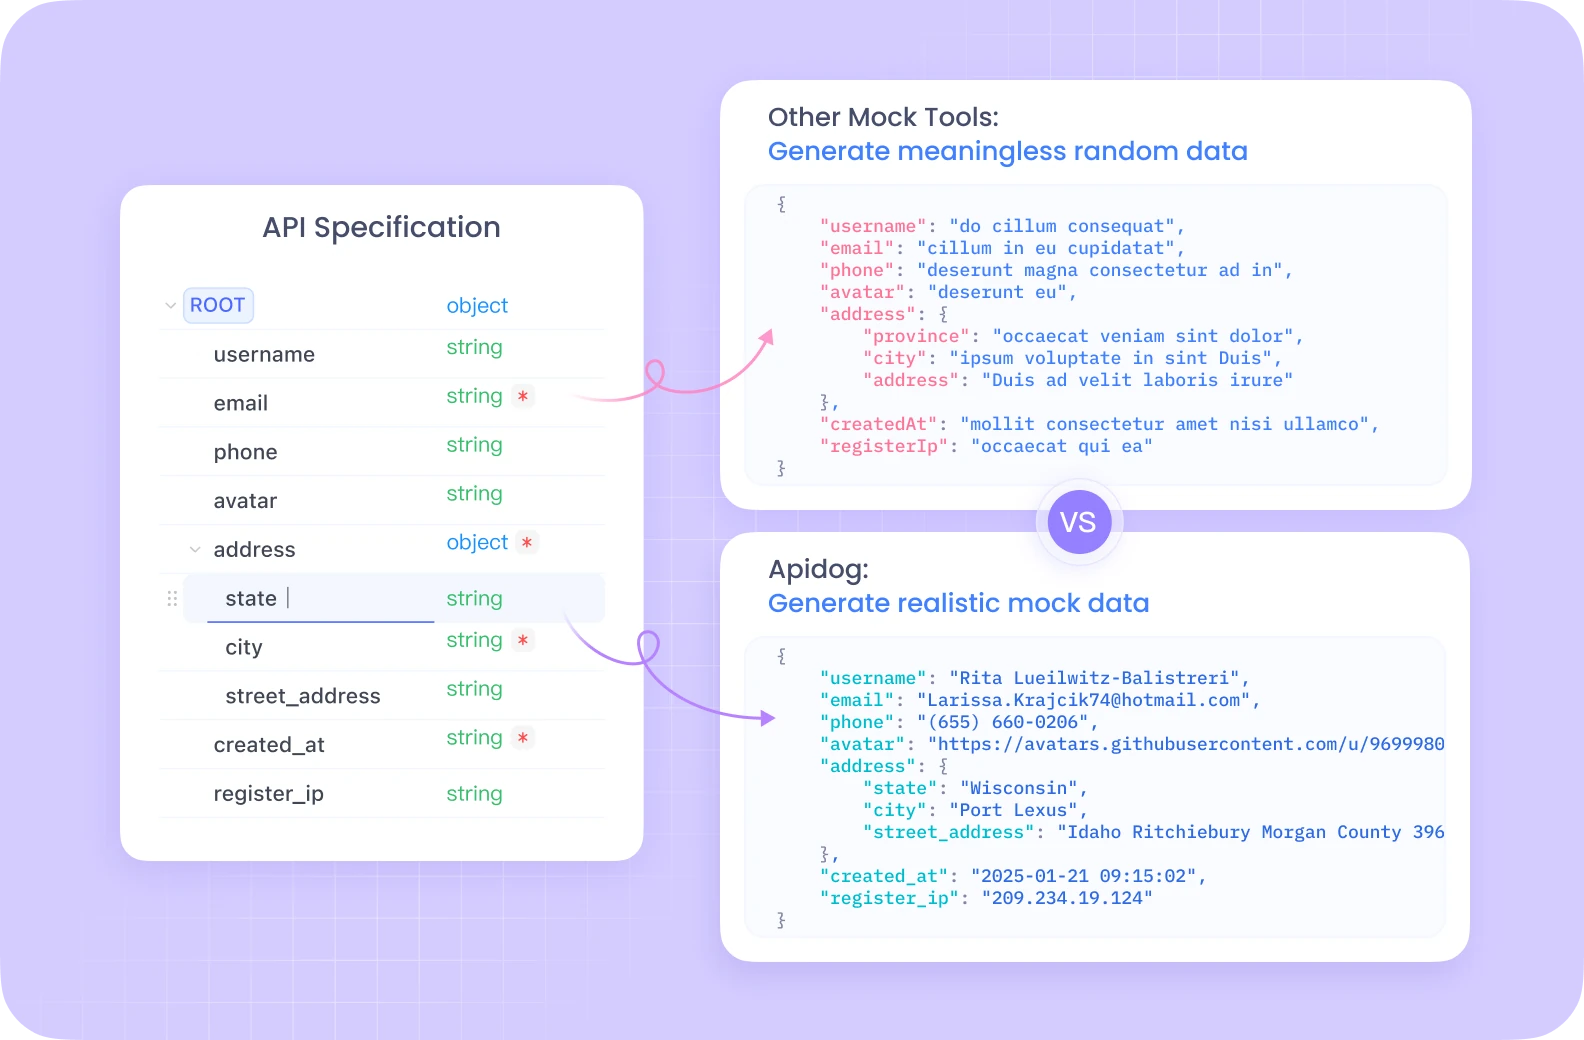
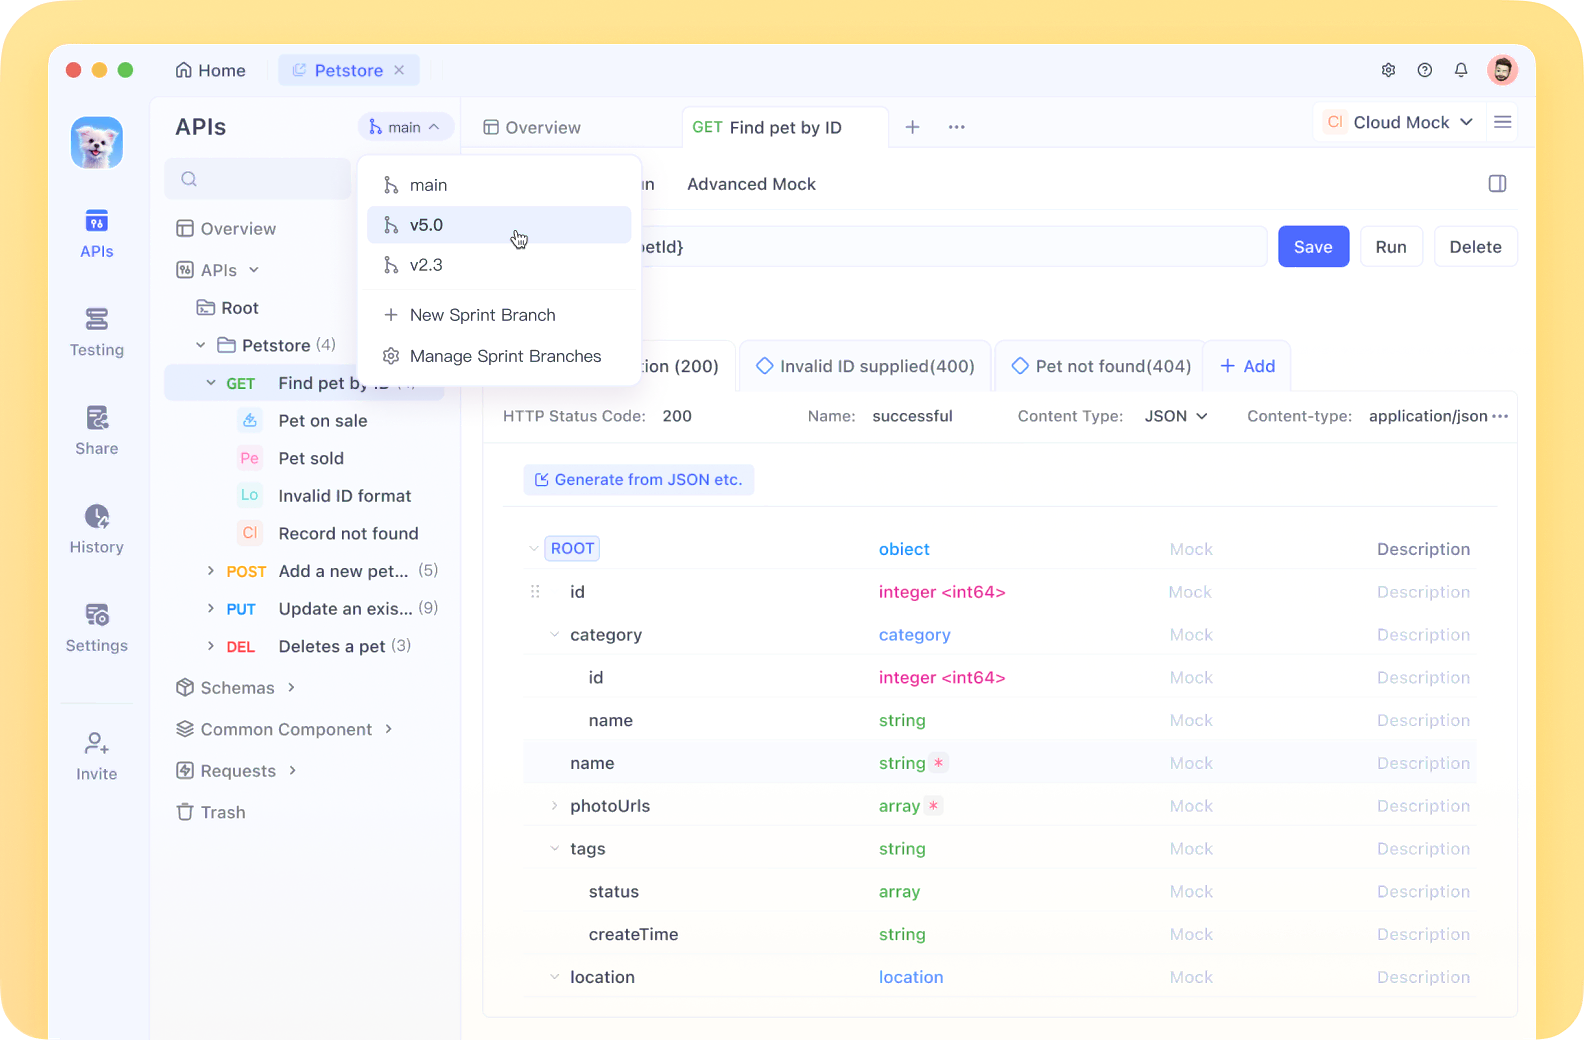
APIdog has emerged as a comprehensive Postman alternative that streamlines API development, testing, and documentation in one unified platform.
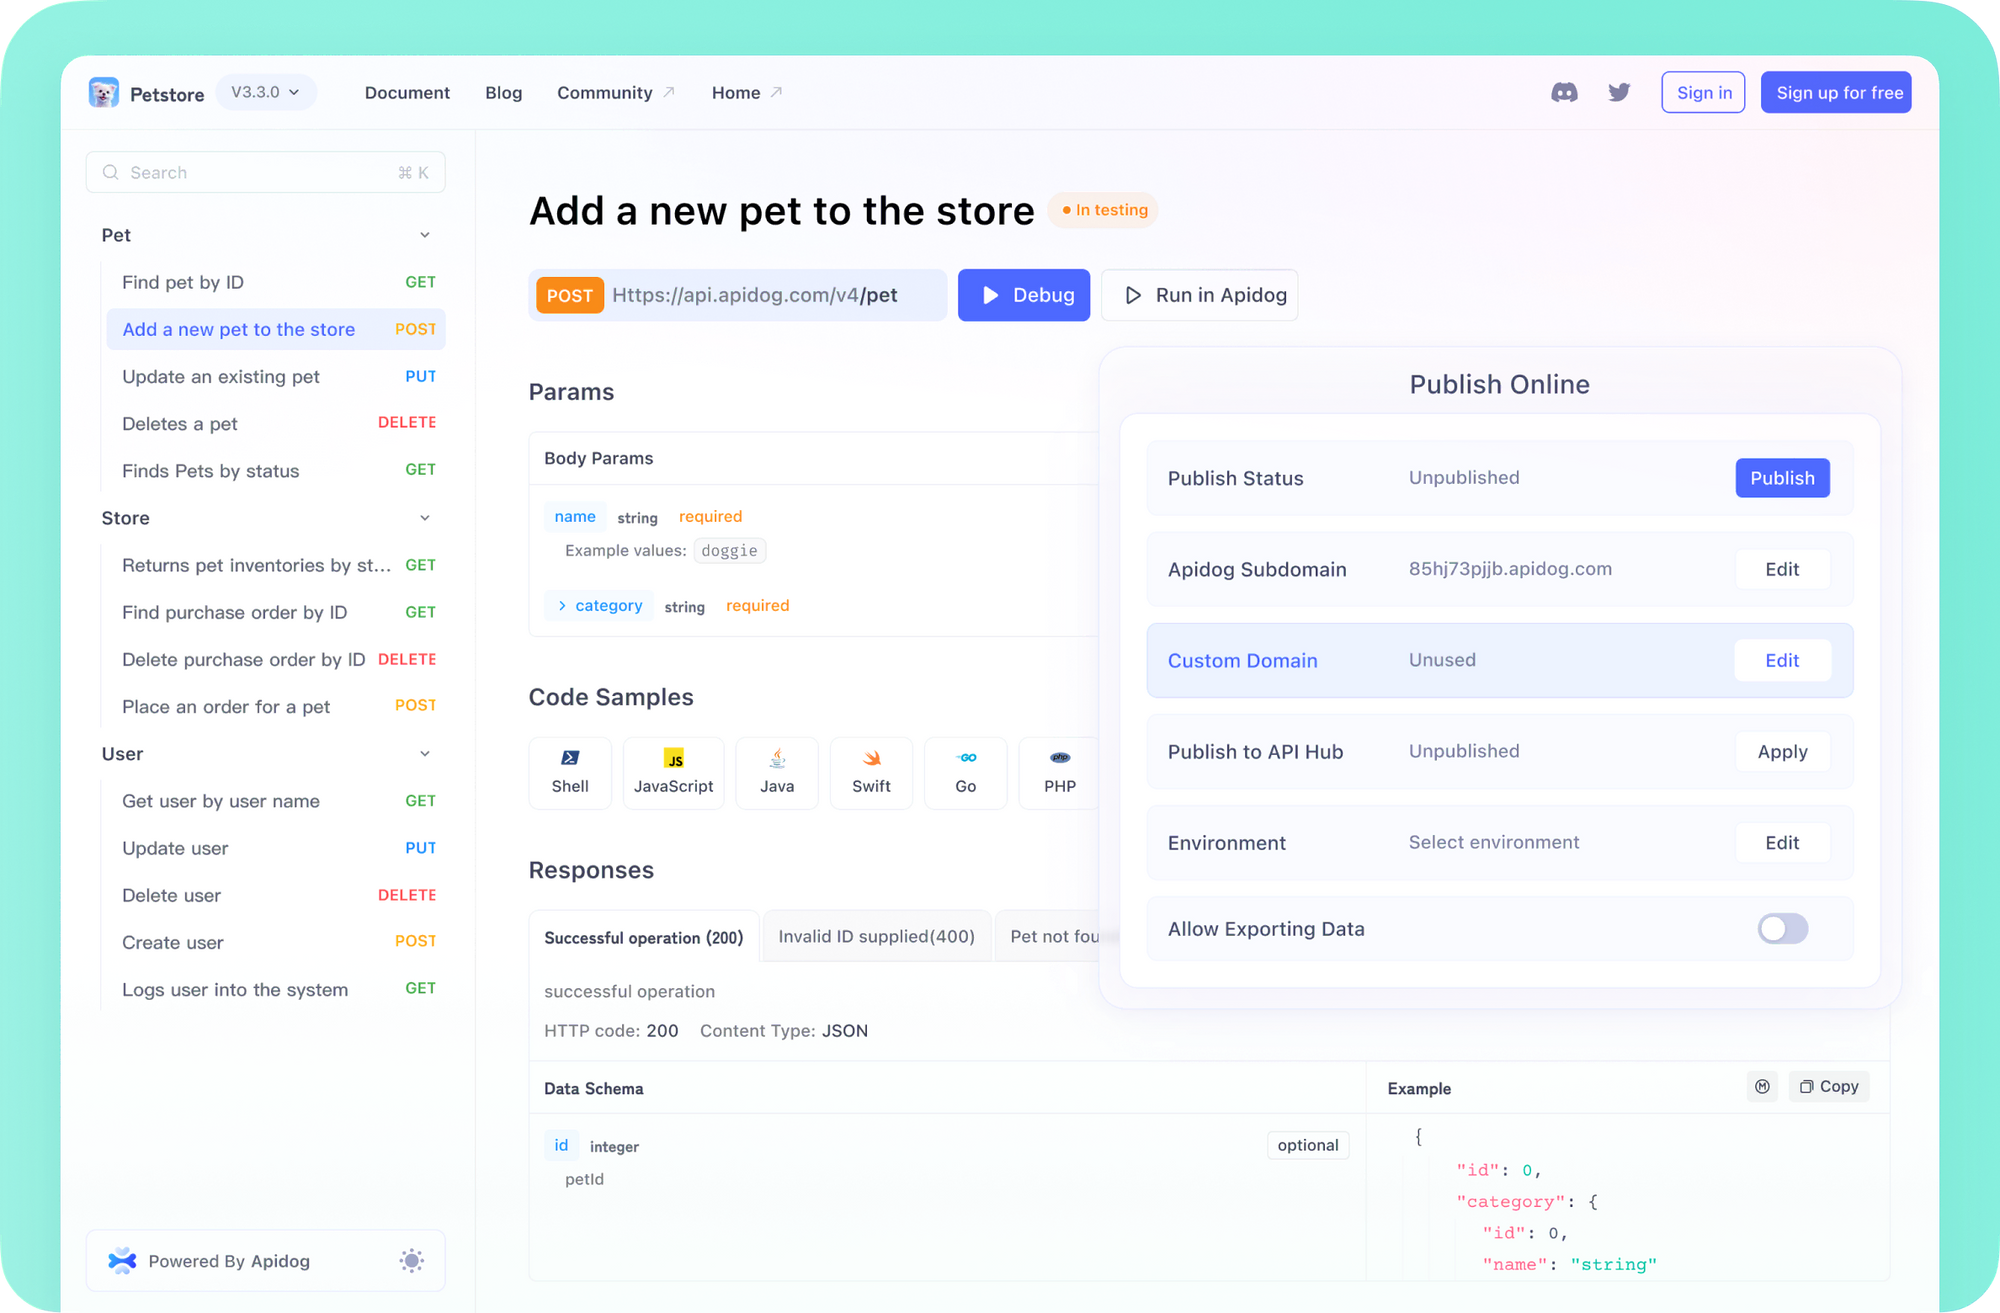
With features like automated testing, performance monitoring, and collaborative workflows, APIdog provides the essential foundation for understanding how your APIs perform under load—making it a valuable companion tool when conducting the throughput testing we'll explore in this article.
By establishing baseline API functionality with tools like APIdog, you can more effectively analyze throughput bottlenecks in your broader performance testing strategy.
Defining Throughput in Performance Testing
Throughput in performance testing can be defined in three key ways:
- Number of Transactions Over Time: Fundamentally, throughput is the number of transactions produced during a specific period in a test. It measures how many requests or operations your system can handle within a given timeframe.
- Required Capacity Measurement: Throughput expresses the amount of capacity a website or application can handle, indicating its processing capability under various load conditions.
- Performance Goal Metric: Before initiating performance tests, organizations typically establish throughput goals—specific numbers of requests per hour that the application must successfully process.
In technical terms, throughput is commonly expressed as transactions per second (TPS) or requests per second (RPS), making it a fundamental unit of measurement in performance testing.
Throughput in Real-World Context: An Analogy
To understand throughput in practical terms, consider this analogy:
Imagine a gas station called "Joe's Gas" with three pumps. Each attendant takes exactly one minute to fill any car, regardless of tank size. With these constraints, Joe's Gas has a maximum throughput of three cars per minute—no matter how many cars arrive, the station can only service three per minute.
This represents a critical performance concept: maximum throughput is a fixed upper-bound constraint. When more vehicles arrive than can be processed (more than three per minute), they form a queue and must wait.
The same principle applies to web applications. If an application receives 50 requests per second but can only process 30 transactions per second, the additional 20 requests end up waiting in a queue, potentially causing delays and degraded user experience.
Measuring Throughput in Performance Testing
Performance testing tools like LoadRunner, JMeter, and k6 come equipped with throughput monitors that help visualize and analyze this metric during tests. A typical throughput measurement process follows this pattern:
- Ramp-Up Phase: As virtual users begin making requests, throughput increases proportionally.
- Steady State: Once all users are active and working in a consistent pattern, throughput typically stabilizes at a plateau.
- Upper Bound Discovery: To identify an environment's maximum throughput, testers gradually increase user load until throughput stops increasing or begins to decline.
- Bottleneck Identification: When throughput plateaus or decreases despite increasing user load, it typically indicates a bottleneck in the application.
Analyzing Throughput Results: Three Test Scenarios
Let's examine three different throughput test scenarios and what they reveal:
Test Scenario #1: Healthy Throughput
In a healthy throughput pattern with 25 concurrent users, we observe that once all users are logged in and active, the throughput remains relatively consistent. This steady throughput indicates that the system is handling the load efficiently without degradation.
Test Scenario #2: Degrading Throughput
In this concerning scenario, throughput initially increases as users log in, but once all users are active, throughput unexpectedly plummets instead of stabilizing. This pattern typically indicates a severe performance bottleneck.
Test Scenario #3: Database Bottleneck Identification
By overlaying throughput data with diagnostic metrics (such as HP Diagnostics' 'J2EE – Transaction Time Spent in Element' chart), we can identify the root cause of throughput problems. In this example, the database layer is consuming excessive processing time, creating a queue of requests and increasing response times.
Factors Affecting Network Throughput and Latency
Several technical factors can contribute to degraded throughput and increased latency:
Hardware Issues
- Obsolete or Faulty Equipment: Outdated routers or malfunctioning devices can significantly limit data flow efficiency
- Network Infrastructure Limitations: Physical limitations in network architecture that restrict bandwidth
Network-Related Factors
- Heavy Traffic: Excessive concurrent requests leading to packet loss
- Propagation Delay: The time required for packets to travel between points at the speed of light
- Transmission Medium: Different mediums (fiber optic, wireless, copper) have different throughput capabilities
- Packet Size: Larger packets require more time to transmit and receive
Processing Delays
- Router Processing Time: Gateway nodes must inspect and potentially modify packet headers
- Computer and Storage Delays: Intermediate devices like switches may cause delays during storage and disk access
- Signal Amplification: Repeaters used to amplify signals can introduce additional latency
Tools for Measuring and Monitoring Throughput
Effective performance testing requires appropriate tools for measuring throughput. Common options include:
- Simple Network Management Protocol (SNMP): An application-layer protocol for managing and monitoring network devices, providing a universal communication method for devices in both single and multi-vendor environments. SNMP v3 offers advanced security features.
- Windows Management Instrumentation (WMI): Microsoft's set of specifications for centralizing management of Windows-powered devices and applications, providing access to system status, configuration, and security settings.
- tcpdump: An open-source command-line tool for monitoring and capturing network traffic, displaying packet headers and supporting Boolean search operators for filtering.
- Wireshark: A comprehensive open-source network traffic analysis tool that provides insights into transmission times, protocols, headers, and source/destination information.
- Performance Testing Tools: Most dedicated performance testing tools like LoadRunner, JMeter, and k6 include built-in throughput monitoring, though they might refer to it as "requests per second."
The Relationship Between Throughput and Other Performance Metrics
Throughput doesn't exist in isolation—it's interconnected with other critical performance metrics:
Throughput vs. Response Time
Higher throughput often leads to increased response times as the system processes more requests. The goal of optimization is to maximize throughput while maintaining acceptable response times.
Throughput vs. Concurrent Users
There's typically a correlation between user load and throughput up to a certain point. After reaching maximum capacity, throughput may plateau or decline regardless of additional users.
Throughput vs. Resource Utilization
System resources (CPU, memory, disk I/O, network) directly impact throughput capacity. Monitoring resource utilization alongside throughput helps identify hardware-related bottlenecks.
Optimizing Throughput in Performance Testing
Based on throughput analysis, several optimization strategies can be implemented:
- Horizontal Scaling: Adding more servers to distribute load and increase overall throughput capacity
- Vertical Scaling: Upgrading existing hardware (more CPU cores, RAM, faster disks) to improve processing capabilities
- Code Optimization: Refactoring inefficient algorithms and database queries that limit throughput
- Connection Pooling: Pre-establishing and reusing database connections to reduce overhead
- Caching Strategies: Implementing appropriate caching to reduce computational load for repetitive requests
- Load Balancing: Distributing incoming requests across multiple servers to optimize resource utilization
Conclusion: The Importance of Throughput in Performance Testing
Throughput is one of the most critical metrics in performance testing, providing direct insight into an application's processing capability under various load conditions. By understanding throughput patterns and their relationship with other performance indicators, testers can:
- Establish realistic performance goals based on business requirements
- Identify system bottlenecks before they affect production environments
- Make data-driven decisions about infrastructure scaling and optimization
- Validate that performance improvements are actually delivering increased capacity
For comprehensive performance testing, throughput should always be analyzed alongside related metrics like response time, error rates, and resource utilization to provide a complete picture of application performance. By mastering throughput analysis, performance engineers can ensure applications deliver consistent, reliable performance even under peak load conditions.
As we've explored the critical role of throughput in performance testing, it's worth revisiting how tools like APIdog can complement your overall testing strategy.
By using APIdog for preliminary API validation and load simulation before full-scale performance tests, teams can identify potential throughput bottlenecks at the API level early in the development cycle. APIdog's intuitive interface allows teams to quickly create, validate, and document API endpoints, while its performance monitoring capabilities provide initial insights into response times and throughput limitations.
This preparatory work with APIdog creates a smoother transition to comprehensive throughput testing, enabling more targeted performance optimization efforts. When comprehensive performance testing reveals throughput issues, having a well-documented API structure in APIdog makes it easier to isolate and address specific endpoints contributing to bottlenecks, creating a more efficient performance testing workflow.


