FastAPI is a modern, high-performance web framework for building APIs with Python 3.7+ based on standard Python type hints. It offers several advantages:
- High Performance: FastAPI is designed for speed, leveraging asynchronous programming to handle thousands of requests per second.
- Automatic Documentation: It automatically generates interactive API documentation using Swagger UI and ReDoc.
- Type Checking: FastAPI uses Python’s type hints to provide automatic data validation and serialization.
Here is how to do a FastAPI application:
from fastapi import FastAPI
app = FastAPI()
@app.get("/")
def read_root():
return {"Hello": "World"}
FastAPI in the Web Stack
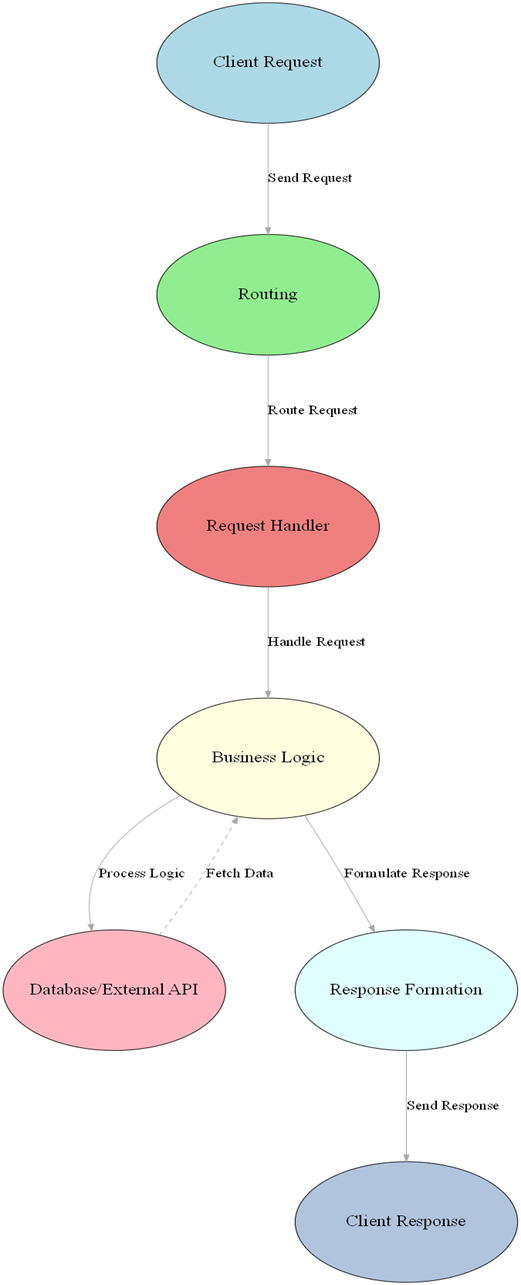
Imagine navigating the bustling web landscape with FastAPI as your trusted guide. Our overview diagram (figure 1)presents a clear and engaging view of how FastAPI seamlessly integrates into the web stack.
At the top, you have client requests — these are the everyday interactions from users looking to access your application. FastAPI steps in as the dynamic bridge between these requests and your server. It’s designed to handle incoming data swiftly and efficiently, ensuring that every interaction is smooth and responsive.
Below the FastAPI application, you’ll find a streamlined process where the magic happens. FastAPI is known for its speed and performance, processing requests with lightning speed and accuracy. It’s like having a top-tier assistant who not only understands your needs but also anticipates them, delivering responses in record time.
Finally, figure 1 shows how responses make their way back to the clients. FastAPI ensures that these responses are not only fast but also highly reliable, enhancing the overall user experience.
So, if you’re looking for a powerful, efficient, and user-friendly solution to elevate your web applications, FastAPI is your go-to choice. Dive into the diagram and see how FastAPI can transform your web stack with its exceptional capabilities.
Overview of Endpoint Invocation
Endpoint invocation refers to the process of sending a request to a specific API endpoint to execute a defined action. In FastAPI, this involves defining routes and handling incoming requests.
Creating Endpoints:
In FastAPI, you define endpoints using decorators. Each decorator corresponds to an HTTP method and URL path.
This is how it works: from fastapi import FastAPI
from fastapi import FastAPI
app = FastAPI()
@app.get("/items/{item_id}")
def read_item(item_id: int, q: str = None):
return {"item_id": item_id, "q": q}
This setup allows users to ask for specific items by their ID, and your application swiftly delivers the information they’re after in a neat JSON format;
- @app.get(“/items/{item_id}”) defines a GET endpoint where item_id is a path parameter.
- The function read_item handles the request and returns a JSON response.
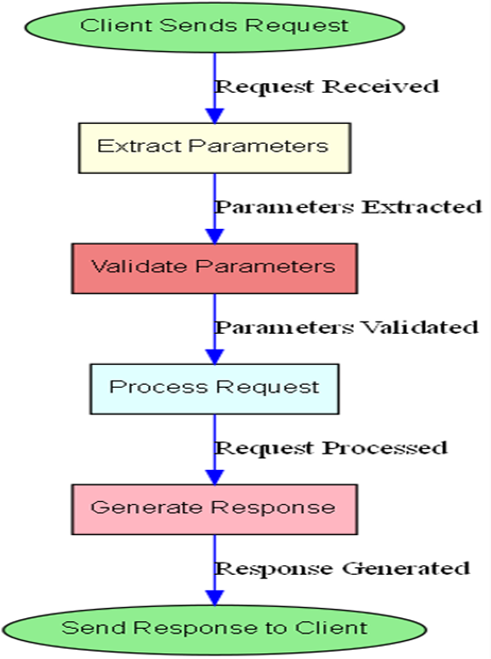
Picture this: a request journeying through your application, and our endpoint diagram(figure 2) is like a map showing its adventure.
First, a request heads towards an endpoint, where it’s greeted and starts its journey. Imagine this as a welcoming gate where the request is prepped and ready. Next up, we dive into parameters. These are like the special instructions or details that guide the request on its way, ensuring it gets to exactly where it needs to go.
Once the request has all its details sorted, it meets the request handling stage. Think of this as the core of the action, where the request is processed, and all the necessary operations are performed to get the right results.
Finally, the request reaches the end of its journey with a response. This is like the final destination where the request’s results are neatly packaged and sent back to where it all started.
So, figure 2 is not just a flowchart — it’s a visual story of how every request travels through your system, getting the right treatment and returning with the perfect response.
Importance of Logging in APIs
Logging is crucial for monitoring, debugging, and maintaining APIs. It helps developers:
- Track Requests and Responses: Understand how the API is being used and troubleshoot issues.
- Monitor Performance: Identify performance bottlenecks and optimize the API.
- Audit and Security: Keep records of API usage for compliance and security audits.
This is how it works:
You can use Python’s built-in logging module to add logging to your FastAPI application:
import logging
from fastapi import FastAPI
app = FastAPI()
# Configure logging
logging.basicConfig(level=logging.INFO,
format='%(asctime)s - %(name)s - %(levelname)s - %(message)s')
logger = logging.getLogger(__name__)
@app.get("/items/{item_id}")
def read_item(item_id: int, q: str = None):
logger.info(f"Received request for item_id: {item_id} with query: {q}")
return {"item_id": item_id, "q": q}
Let’s dive into how logging works with this setup.
First, logging.basicConfig
is like setting up the rules for how you want to handle your logs. It’s where you decide things like where your logs go and how they should be formatted. Think of it as setting up your logging toolkit so everything is in place for capturing important information.
Next, we have logger.info
. This is where the magic happens. When you call logger.info
, you’re adding an informational message to your logs. In this case, it’s all about logging details about a request. It’s like taking notes on what’s happening, so you have a record of it for future reference.
Now, onto the Logging flow diagram (figure 3). This diagram is like a visual guide showing how a request gets logged from start to finish. It maps out the journey, from setting up your logging configuration to capturing and recording the message. It’s a handy way to see how all the pieces come together to keep track of your application’s activities.
Setting Up FastAPI for Version 2 Endpoints
Welcome to the world of FastAPI! If you’re eager to harness the power of one of the fastest frameworks for building APIs with Python, you’re in the right place. Whether you’re upgrading your existing APIs to version 2 or starting fresh, this guide will walk you through everything you need to get started. From installing FastAPI and Uvicorn to setting up your project structure and crafting a basic application, we’ve got you covered. Let’s dive in!
1. Installing FastAPI and Uvicorn
Why FastAPI? FastAPI is renowned for its speed, simplicity, and modern features. It’s perfect for building APIs that are both fast and easy to maintain.
Why Uvicorn? Uvicorn is a high-performance ASGI server that’s ideal for running FastAPI applications. It supports async operations, making it a great choice for scalable applications.
Getting Started:
To install FastAPI and Uvicorn, simply run:pip install fastapi uvicorn
Features to Highlight:
- FastAPI: Enables automatic interactive documentation, validation, and asynchronous support.
- Uvicorn: Acts as a high-speed ASGI server, perfect for development and production environments.
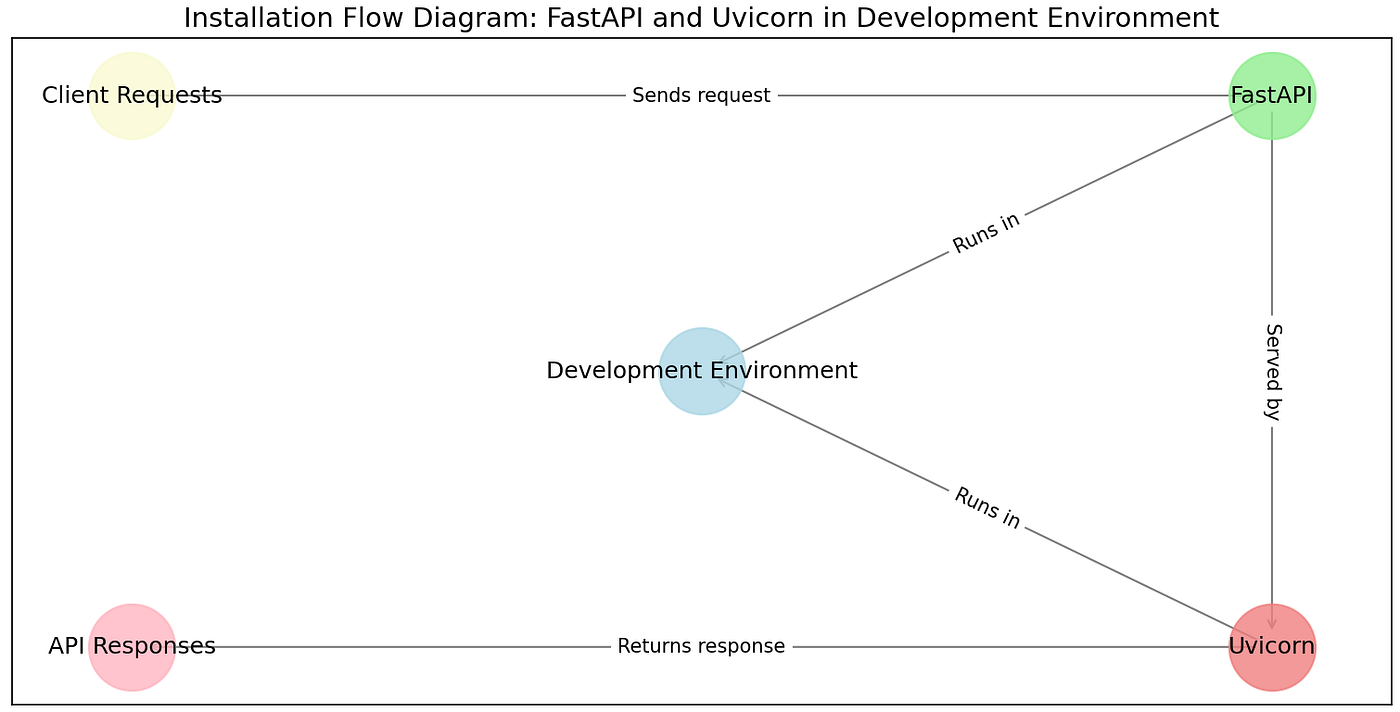
Imagine you’re setting up your development environment, and you want to see how everything fits together. The Installation Flow Diagram (figure 4) is like a map that shows you exactly how FastAPI and Uvicorn come together to make your web application run smoothly.
Think of FastAPI as the powerful API framework that handles all the magic behind your application’s requests and responses. It’s like the brain of your application, processing data and managing interactions.
Now, Uvicorn is the server that brings FastAPI to life. It’s the reliable engine running behind the scenes, making sure FastAPI handles incoming requests and delivers responses efficiently.
This diagram helps you visualize how FastAPI and Uvicorn interact within your development setup. It shows the relationship between them and how they fit into the larger picture of your server and application framework. It’s a handy way to understand the flow and see how each piece contributes to the whole.
2. Project Structure and Dependencies
Why Organize Your Project? A well-structured project not only helps with maintaining and scaling your application but also ensures that collaboration with others is smooth and efficient.
How to Set Up:
1. Create the Project Directory: Organize your project files into directories.
2. Define Dependencies: Use requirements.txt
to list all packages, making it easy to install them with:pip install -r requirements.txt
Think of the Project Structure Diagram (figure 5) as a blueprint for your codebase. It’s like a detailed map that shows you how everything is organized in your project.
Imagine you’re setting up a new project and you need to figure out where to put different pieces like endpoints, models, and schemas. This diagram makes it easy to see where each part should go.
It’s like having a well-organized filing cabinet where you know exactly which drawer to open for your API endpoints, where to file your data models, and where to keep your schemas. By visualizing the structure, you can quickly understand how all the components fit together and keep your project neat and manageable.
• app/main.py: The heart of your FastAPI application.
• app/api/v2/endpoints.py: Where you’ll define your version 2 endpoints.
• requirements.txt: A file listing all dependencies for your project.
3. Creating a Basic FastAPI Application
Why Start Simple? A simple, functional application sets the stage for adding more complex features. It ensures you understand the core components of FastAPI before diving deeper.
How the Basic Application works:
# app/main.py
from fastapi import FastAPI
app = FastAPI()
@app.get("/")
def read_root():
return {"message": "Welcome to FastAPI!"}
@app.get("/items/{item_id}")
def read_item(item_id: int, q: str = None):
return {"item_id": item_id, "query": q}
Running Your Application:
To see your FastAPI app in action, run:
uvicorn app.main:app --reload
Visit http://127.0.0.1:8000
in your browser, and you’ll see your API in action. Don’t forget to check out the interactive API documentation at:
Features to Highlight:
• Interactive Documentation: Automatically generated and accessible through /docs and /redoc.
• Asynchronous Support: FastAPI allows for high concurrency with async operations.
Imagine you’re tracking a request as it travels through your FastAPI application. The Basic Application Flow Diagram illustrated in figure 6 is like a step-by-step guide that shows this journey in action.
Here’s how it works: a request comes in, and the diagram shows exactly how it gets processed. First, your FastAPI application receives the request — think of it as the starting point where your application welcomes the incoming data.
Next, the diagram outlines the journey of this request as it gets handled. This includes any processing, interactions with databases, or any other operations your application performs.
Finally, it shows how the application wraps up everything and sends a response back. It’s like tracking a package from the moment it arrives at the warehouse to when it gets delivered to the customer.
Setting up FastAPI for version 2 endpoints is a breeze and definitely worth it. With FastAPI’s powerful features and Uvicorn’s speed, you’ll be building efficient and scalable APIs in no time.
Enhancing Logging with Version 2 Endpoints
When it comes to building robust and scalable web applications, logging isn’t just a feature; it’s a critical component that helps in monitoring, debugging, and maintaining application health. With FastAPI, you can leverage advanced logging capabilities to ensure that your application runs smoothly and issues are addressed promptly. In this guide, we’ll walk you through enhancing your logging setup with FastAPI, focusing on Version 2 endpoints. Let’s dive in!
Introduction to FastAPI Logging Features
FastAPI offers built-in support for logging, which is essential for tracking application behavior and diagnosing issues. Logging provides a way to record events, errors, and other significant occurrences in your application. This functionality is crucial for understanding application performance and user interactions.
Why Logging Matters:
• Debugging: Quickly identify and resolve issues in your code.
• Monitoring: Keep track of application health and performance.
• Auditing: Record user actions and system changes for security and compliance.
FastAPI integrates seamlessly with Python’s standard logging library, allowing for flexible and powerful logging configurations.
Here’s a quick look at how logging fits with FastAPI:
- FastAPI Box: The central “FastAPI Application” is highlighted in blue, showing it as the heart of your setup.
- Logging Levels: INFO (green), DEBUG (orange), and ERROR (red) are the different logging levels, each connected to FastAPI with arrows.
- Python Logging System: This is in gold on the right, indicating it handles all the log messages from FastAPI.
Figure 7 helps you see how FastAPI works with Python’s logging library, illustrating how different log levels interact with your application.
Setting Up Logging Configuration
Configuring logging in FastAPI involves setting up a logging configuration that suits your needs. You can define logging levels, format messages, and specify where logs should be output (console, file, etc.).
Steps to Configure Logging:
- Import the Logging Module: Use Python’s
logging
module to set up your configuration. - Define Logging Configuration: Set the logging level, format, and handlers.
- Initialize Logging in FastAPI: Apply the configuration to your FastAPI application.
Here’s a basic setup for logging in FastAPI:
import logging
from fastapi import FastAPI
# Configure logging
logging.basicConfig(level=logging.INFO, # Adjust the level as needed
format='%(asctime)s - %(name)s - %(levelname)s - %(message)s',
handlers=[logging.StreamHandler()]) # Logs to console
app = FastAPI()
@app.get("/")
def read_root():
logging.info("Root endpoint accessed")
return {"Hello": "World"}
@app.get("/items/{item_id}")
def read_item(item_id: int):
logging.debug(f"Item requested: {item_id}")
if item_id > 10:
logging.error("Item ID is too high")
return {"item_id": item_id}
Features to Highlight:
• Logging Levels: INFO, DEBUG, ERROR — use different levels to control the verbosity of logs.
• Custom Handlers: Direct logs to files, remote servers, or other destinations.
• Message Formatting: Customize log message formats to include timestamps, log levels, etc.
Here’s a quick rundown of how logging is set up:
- Logging Configuration: At the top, a gold box shows where the logging setup happens.
- Application Components: Three blue boxes represent different parts of your app where logs are generated.
- Logger: The green box gathers these logs and directs them where they need to go.
- Handlers: Two red-orange boxes show the File and Console Handlers that process and format the logs.
- Destinations: Purple boxes on the right indicate where the logs end up, like log files or the console.
This flowchart illustrated in figure 8 makes it easy to see how log messages travel from your app to their final destinations.
Implementing Version 2 Endpoints for Logging
With FastAPI, Version 2 endpoints offer enhanced capabilities for logging. You can build on top of FastAPI’s standard logging to implement more sophisticated logging strategies for your endpoints.
Key Considerations:
• Structured Logging: Use structured logs to capture detailed and actionable information.
• Enhanced Error Handling: Log detailed error information to diagnose issues effectively.
• Performance Metrics: Track performance metrics such as request duration and throughput.
Here’s how you can implement logging in Version 2 endpoints:
from fastapi import FastAPI, Request
import logging
app = FastAPI()
# Enhanced logging configuration
logging.basicConfig(level=logging.INFO,
format='%(asctime)s - %(name)s - %(levelname)s - %(message)s',
handlers=[logging.FileHandler("app.log"), logging.StreamHandler()])
@app.post("/log")
async def log_endpoint(request: Request):
body = await request.json()
logging.info(f"Received request with body: {body}")
return {"status": "logged"}
@app.get("/performance")
def performance_metrics():
# Example of logging performance metrics
start_time = logging.datetime.now()
# Simulate processing
logging.info(f"Performance metrics requested at {start_time}")
return {"metrics": "sample_metrics"}
Features to Highlight:
• Asynchronous Logging: Handle logs in an asynchronous manner for better performance.
• File Logging: Save logs to a file for persistent storage.
• Performance Logging: Capture and analyze performance metrics.
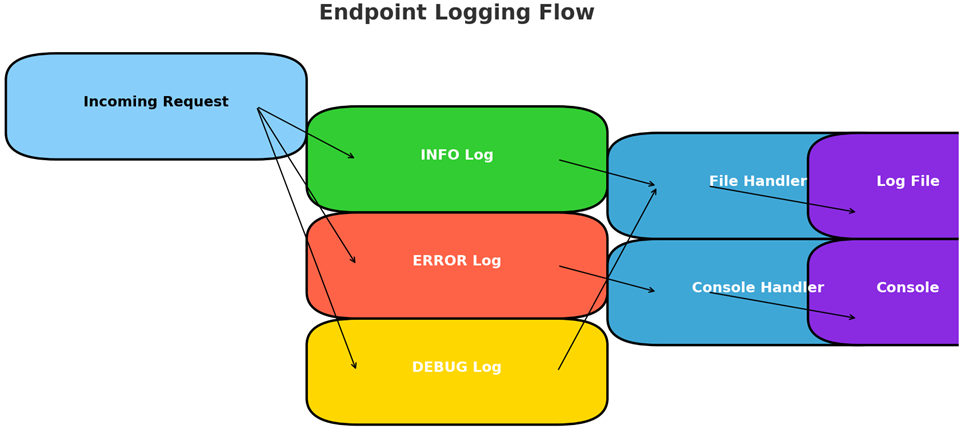
Here’s a simple overview of how logging works with your requests:
1.Request Box: This light blue box is where incoming requests start.
2.Log Types:
• INFO logs are in green.
• ERROR logs are in red.
• DEBUG logs are in gold.
3.Handlers: Logs move to:
• File Handler (blue).
• Console Handler (also blue).
4.Destinations: Logs end up in:
Log File or Console (purple).
Figure 9 shows how requests lead to different log types, which are then handled and directed to their final destinations. Setting this up properly ensures you get clear insights and can keep your FastAPI app running smoothly.
Advanced Logging Features and Best Practices
In any FastAPI application, logging goes beyond just recording messages in a console. It’s about building a robust system that helps you trace issues, monitor performance, and manage errors effectively. By leveraging advanced logging features and best practices, you can turn your logs into a valuable tool for maintaining and scaling your application.
Let’s explore some of the more advanced features of logging in FastAPI, focusing on dependency injection for logging, customizing log messages, and best practices for handling exceptions and errors.
Using Dependency Injection for Logging
Dependency injection in FastAPI is an incredibly powerful feature, and it extends to logging as well. Instead of configuring logging separately in each function, you can inject it into your routes, making your code cleaner and more scalable.
Why Use Dependency Injection for Logging?
• Consistency: Ensures a consistent logging configuration across all endpoints.
• Reusability: Allows you to define and use logging configurations centrally, avoiding redundant code.
• Flexibility: Makes it easier to modify your logging setup without changing individual endpoint code.
Here’s how you can inject a logging instance using FastAPI’s Depends function:
import logging
from fastapi import FastAPI, Depends
app = FastAPI()
# Logging configuration
def get_logger():
logger = logging.getLogger("app_logger")
logger.setLevel(logging.INFO)
if not logger.handlers:
handler = logging.StreamHandler()
handler.setFormatter(logging.Formatter('%(asctime)s - %(levelname)s - %(message)s'))
logger.addHandler(handler)
return logger
@app.get("/items/")
def read_items(logger=Depends(get_logger)):
logger.info("Items endpoint accessed")
return {"message": "Fetching items"}
Features to Highlight:
• Centralized Logger Configuration: With dependency injection, you only define your logger once.
• Automatic Injection: FastAPI automatically provides the logger to any endpoint that needs it.
Figure 10 illustrates Dependency Injection Flow which shows how requests turn into logs, how they’re handled, and where they end up. It’s all about keeping your FastAPI app running smoothly with clear logging.
Key Aspects of dependency injection flow chart:
• Client Request: The starting point where the client sends a request to the FastAPI application.
• FastAPI Endpoint: Represents the endpoint in FastAPI where dependency injection occurs.
• Logger Injected via DI: Shows that the logger is injected into the endpoint using FastAPI’s dependency injection mechanism.
• Logging (Request Info): Logs the request details, such as method, path, and other useful information.
• FastAPI Response: The response returned back to the client after logging the request.
Customizing Log Messages
The ability to customize log messages is crucial for making your logs informative and actionable. Default logs may not always provide enough context, especially in production environments. FastAPI’s integration with Python’s logging module makes it easy to add custom details to your logs.
Key Strategies for Customizing Log Messages:
• Add Request Information: Include request details like IP address, headers, and path.
• Add Contextual Information: Customize logs to include information relevant to the current endpoint or operation, such as user actions or specific resource details.
• Format for Readability: Use structured logs or JSON format for better readability and easier integration with logging tools like ELK stack.
Here’s how to customize log messages with request details:
from fastapi import Request
@app.middleware("http")
async def log_requests(request: Request, call_next):
logger = logging.getLogger("custom_logger")
logger.info(f"Incoming request: {request.method} {request.url}")
response = await call_next(request)
logger.info(f"Response status: {response.status_code}")
return response
Features to Highlight:
• Middleware for Logging: This middleware logs both incoming requests and outgoing responses.
• Custom Information: You can log specific details such as request method, URL, and response status.
Imagine this Customized Log Flow illustrated in figure 11 as a guide for tracking a request through your system. It starts with the request moving through middleware, where it gets logged with custom details. Then, as the process continues, the response is also logged. The chart highlights the key spots where those custom log messages are added, giving you a clear view of how everything’s tracked and recorded.
Handling Exceptions and Errors
When errors occur in your application, logging plays a crucial role in tracking down the root cause. FastAPI’s exception handling features, combined with logging, ensure that you capture and log detailed information about errors without exposing sensitive details to users.
Best Practices for Logging Exceptions:
• Log Detailed Error Information: Capture stack traces, error messages, and request context.
• Log Different Error Levels: Use appropriate logging levels like ERROR or CRITICAL for exceptions to differentiate them from regular log entries.
• Avoid Over-Logging: Be mindful of logging sensitive information or too many details that could clutter your logs.
Here’s how handling and logging exceptions in FastAPI:
from fastapi import HTTPException
import logging
@app.get("/items/{item_id}")
def read_item(item_id: int, logger=Depends(get_logger)):
try:
if item_id > 100:
raise HTTPException(status_code=404, detail="Item not found")
logger.info(f"Item {item_id} fetched successfully")
return {"item_id": item_id}
except HTTPException as e:
logger.error(f"Error fetching item {item_id}: {e.detail}")
raise e
Features to Highlight:
• Structured Exception Logging: Log detailed information when an exception occurs, including the item ID and error details.
• Graceful Error Handling: Raise HTTP exceptions while logging the issue for further analysis.
The Exception Logging Flow Diagram shows how exceptions are handled in your FastAPI app. The Flow Representation is as follows:
• Normal flow: Client sends a request → Middleware processes it → Endpoint generates a response → Client receives the response.
• Exception flow: If an exception occurs at the endpoint, it is logged, and a custom error response is sent back to the client.
By using advanced logging practices, you’ll boost your app’s reliability and ease of maintenance. Good logging helps you catch issues early and keep things running smoothly. Embrace these practices, and you’ll have fewer headaches and a more robust FastAPI application!
Testing and Debugging Your API
In the realm of API development, testing and debugging are your best allies for ensuring a robust and reliable application. Let’s dive into how you can test and debug your FastAPI endpoints to ensure they perform as expected and are ready to handle real-world scenarios with grace.
Writing Tests for Your Endpoints
Why Test? Testing is the safety net that catches bugs before they catch your users. For your FastAPI application, writing tests for your endpoints ensures that every request and response adheres to your expectations, minimizing the risk of unexpected behaviors.
- Start with Unit Tests: Use FastAPI’s test client to write unit tests for individual endpoints. This helps in validating the core functionality of your API.
from fastapi.testclient import TestClient
from myapp import app
client = TestClient(app)
def test_read_main():
response = client.get("/")
assert response.status_code == 200
assert response.json() == {"message": "Hello World"}
Imagine you’ve just built a new app, and now you want to make sure you’ve tested all its parts thoroughly. That’s where our Test Coverage Diagram comes into play. Think of it as a visual map of your application, showing which areas are well-covered by tests and which ones might need a bit more attention.
In the diagram, you’ll see several colored rectangles representing different components of your application, such as Endpoints, Models, Database, Services, Utilities, and Middleware. Each color highlights a different part of your system, making it easy to distinguish between them at a glance.
Here’s the interesting part: some of these components have a neat checkmark on them, meaning they’ve been thoroughly tested. But, and here’s where it gets crucial, some components are marked with a red dashed arrow and the label “Not Covered.” This red indicator is like a flashing light that tells you, “Hey, this part of your app might be at risk because it hasn’t been tested yet.”
So, this diagram isn’t just a pretty picture — it’s a practical tool that helps you identify gaps in your test coverage and ensures you’re not missing any critical parts of your application. It’s all about giving you a clear view of where your testing efforts are paying off and where you might need to step up your game.
2. Expand to Integration Tests: Test how different components of your application work together. For example, ensure that database interactions and external API calls are functioning as intended.
def test_create_item():
response = client.post("/items/", json={"name": "item1", "price": 10.0})
assert response.status_code == 201
assert response.json() == {"name": "item1", "price": 10.0, "id": 1}
3. Leverage Test Suites: Organize your tests into suites to streamline the testing process and ensure comprehensive coverage. Use tools like pytest
to automate and manage your test runs.
# Run all tests using pytest
pytest --maxfail=1 --disable-warnings -q
Debugging Common Issues
Debugging is akin to detective work in programming. It’s about tracing the root causes of issues and resolving them efficiently.
- Use Logging Effectively: Incorporate robust logging in your application to trace the flow of requests and pinpoint where things might be going wrong. Utilize different log levels (
INFO
,DEBUG
,ERROR
) to capture the right amount of detail.
import logging
logging.basicConfig(level=logging.DEBUG)
logger = logging.getLogger(__name__)
def some_function():
logger.info("Starting the function")
try:
# Code that might raise an exception
pass
except Exception as e:
logger.error(f"An error occurred: {e}")
2. Leverage FastAPI’s Debug Mode: When running your FastAPI application, enable debug mode to get detailed error messages and stack traces that can guide you to the source of issues.
uvicorn myapp:app --reload --debug
3. Interactive Debugging: Use debugging tools such as pdb
or integrated development environment (IDE) debuggers to step through your code and inspect variables in real-time.
import pdb
def my_function():
pdb.set_trace() # This will start the debugger at this line
# Code to debug
Best Practices for API Testing
Looking ahead, there’s always room for improvement. Consider adding custom loggers that filter logs based on their importance, or integrating external monitoring tools to capture detailed analytics.
As your API evolves, investing in robust error handling and structured logging will become even more critical for scaling and maintaining your service. Versioning your endpoints thoughtfully will also ensure backward compatibility while continuously improving the system’s architecture.
Another area for enhancement is performance optimization — introducing asynchronous request handling can dramatically boost response times. Additionally, integrating your API with caching mechanisms or load balancers can help scale the infrastructure as user demand grows.
Don't forget to document your API testing process as well. Testing is an integral part of API management, and documenting it ensures transparency and reliability. With APIDog, you can streamline both API testing and documentation processes into one cohesive workflow.
- When it comes to API documentation, maintaining accuracy and relevance is crucial. One of the most effective ways to ensure this is by automating your documentation process. APIDog offers a seamless solution for automating API documentation, ensuring that your docs are always up-to-date without manual intervention.
- For example, if you add, remove, or rename a parameter in a new API version, APIDog automatically reflects these changes in the documentation as soon as they go live. This approach has proven to be highly effective in keeping documentation consistent, reducing errors, and enhancing the developer experience.
You can check the following example of API Documentation, generated by APIDog:
- By automating your API documentation with APIDog, you ensure that your users always have access to the most current and reliable information.
Final thoughts
As we wrap up, let’s recap the key points we’ve covered throughout this discussion. FastAPI has demonstrated its power and simplicity for building efficient, scalable APIs.
The more you tailor your APIs to your specific use cases, the more powerful and efficient they’ll become. Don’t stop here — push your limits, experiment with advanced integrations, and share your experiences with the community.
Feel free to explore further, test new ideas, and come back for more insights. Together, we can transform good APIs into exceptional ones. Ready to enhance your API game?
Let’s dive deeper into the world of FastAPI and all it offers!