
In today's digital era, the performance of web applications is not just a desirable attribute but a fundamental requirement. What is Performance Testing? Performance testing, an integral part of software testing, ensures that your web applications can handle anticipated loads, delivering a smooth and satisfactory user experience. Beyond mere bug discovery, performance testing is about proactively validating the scalability and reliability of your applications under real-world load conditions.
Apache JMeter for Performance Testing
When it comes to performing robust performance testing, Apache JMeter is a name that stands out. This open-source, 100% pure Java application is purpose-built for load and performance testing.
Its ability to test static and dynamic resources and simulate heavy loads on various elements makes it a reliable choice for performance testing across diverse sectors. JMeter has cemented its position as a preferred solution for performance testing needs by boasting many features, from a comprehensive test IDE to a highly extensible core.
Versatility in Performance Testing in Apache JMeter
One of the defining features of JMeter is its versatility. Its ability to test performance on static and dynamic resources sets it apart. Whether you are testing a single server or a group of servers, a network, or an object, JMeter provides you the flexibility to evaluate its strength and overall performance under different load types. Furthermore, it supports a broad spectrum of applications, servers, and protocol types, including but not limited to Web - HTTP, HTTPS, SOAP/REST Webservices, FTP, databases via JDBC, LDAP, and various message-oriented middleware via JMS.
Key Features of Apache JMeter
Apache JMeter is packed with features that cater to diverse performance testing needs. Its full-featured Test IDE allows fast Test Plan recording, building, and debugging, while its Command-line interface (CLI) mode facilitates load testing from any Java-compatible OS. The extensible core of JMeter is another significant attribute, with pluggable Samplers allowing unlimited testing capabilities, and a multi-threading framework enabling concurrent sampling by many threads and simultaneous sampling of different functions by separate thread groups.
Understanding JMeter's Limitations: Not a Browser
While JMeter is a powerful tool, it's important to understand its limitations to leverage its capabilities effectively. JMeter operates at the protocol level and not as a browser. Although it can emulate the actions of a browser to a certain extent, it does not execute JavaScript found in HTML pages nor render them as a browser would. It's worth noting these limitations when planning your performance testing strategy with JMeter.
As we further explore the functionalities and applications of JMeter, you'll discover how to efficiently harness its capabilities to optimize your web application's performance, thereby delivering an impeccable user experience.
Apidog: A Comprehensive Suite for API Lifecycle Management
Parallel to performance testing, managing an API's lifecycle is crucial to modern web application development. This is where Apidog steps in. Apidog is an all-encompassing toolkit that integrates every stage of the API lifecycle under one roof. From designing and debugging APIs to automating lifecycle testing and creating visually engaging API documentation, Apidog facilitates API Design-first development, helping R&D teams implement best practices.
Apidog is a powerful tool that can play a significant role in your performance testing strategy.
This tool offers three distinct modes of performance testing:
- Apidog in-app testing: This type allows you to run multiple threads concurrently by setting the number of threads greater than 1 during test case execution. However, please note that this feature is still in the beta stage and is being optimized. For high concurrency testing, Apidog recommends using JMeter.
- Apidog CLI testing: Apidog CLI is a command-line tool designed for continuous integration and stress testing. The stress testing feature is under development and promises to bring even more versatility to the Apidog suite.
- JMeter testing: With Apidog, you can export test cases in JMeter format and then import them into JMeter for performance testing. This feature effectively integrates the powerful testing capabilities of JMeter into the Apidog environment, enabling more comprehensive performance testing strategies.
Unifying JMeter and Apidog for Optimized Web Application Development
The amalgamation of JMeter's robust performance testing capabilities and Apidog's comprehensive API lifecycle management forms a potent combination for developers. These tools provide an all-rounded approach to building, testing, and managing web applications, ensuring quality, performance, and seamless user experiences.
In this article, we'll delve deeper into JMeter and Apidog's intricacies and learn how to use them effectively for performance testing.
Downloading and Installing JMeter
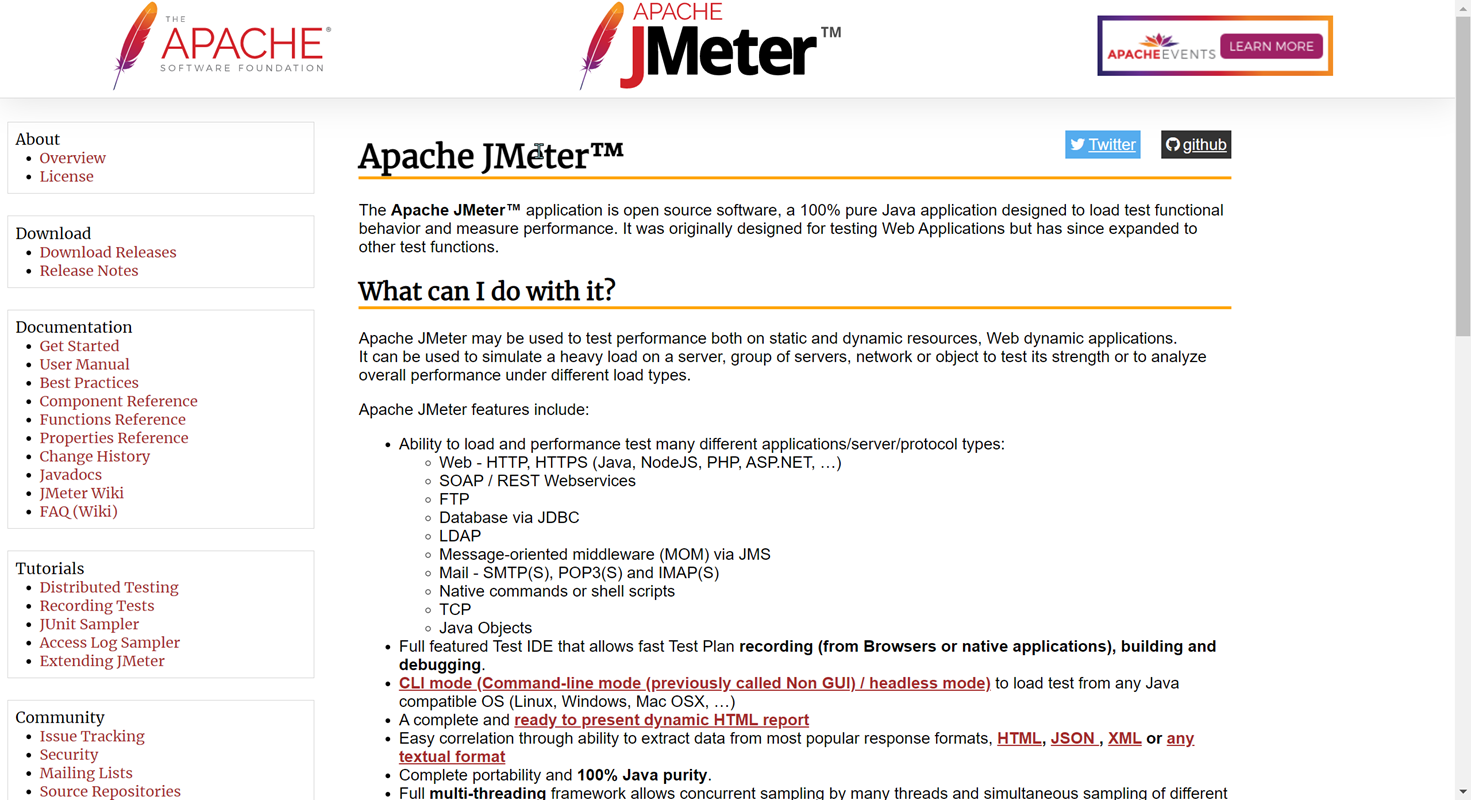
JMeter is a powerful open-source Java application designed for load testing and functional testing of software. It was originally designed for testing Web Applications but has since expanded to other test functions. To get started with JMeter, you'll need to download and install it on your computer:
- Visit the Apache JMeter website.
- Click on the "Download Releases" link.
- Choose the appropriate binary release for your system (for example, apache-jmeter-5.4.1.zip for Windows) and download it.
- Once the download is complete, extract the zip file to a location on your computer.
- To launch JMeter, navigate to the bin folder within the extracted JMeter directory and double-click on the jmeter.bat (for Windows) or jmeter.sh (for Linux/Mac) file.
Overview of the JMeter Interface
Upon launching JMeter, you'll be greeted with its interface which primarily consists of two sections:
- Test Plan: The Test Plan is where you design your load test. It contains elements like Thread Groups (simulating users), Samplers (HTTP requests), and Listeners (results processing and visualization).
- Workbench: The Workbench is a temporary workspace for storing test elements. It's a place to keep elements or parts of your test plan that you're not currently using but may use later.
4 Types of Performance Testing
Performance testing is a discipline concerned with testing and reporting on the speed, stability, and scalability of software applications. There are several types of performance testing, each with a specific purpose.
- Load Testing: This is the most common form of performance testing. It involves applying a load to the system and gradually increasing it over time. The goal is to identify bottlenecks and understand how the system performs under heavy loads.
- Stress Testing: This involves testing the system under extreme loads, often to the point of failure. The objective is to understand the system's breaking point and identify how it recovers once the load is reduced.
- Soak Testing (Endurance Testing): This involves running a system at high load levels for extended periods. The goal is to identify issues that may not appear under a standard load, such as memory leaks or other resource utilization problems.
- Spike Testing: This involves suddenly increasing or decreasing the load on the system and observing the behavior. The goal is to ensure that the system can handle sudden changes in load.
JMeter Tutorial: Configuring JMeter for First Use
You'll need to configure JMeter appropriately to perform any of these tests. Here's a basic example of how to set up a load test in JMeter:
- Create a Test Plan: JMeter organizes tests in what is known as "Test Plans". You can create a new test plan by right-clicking on the Test Plan element in the left sidebar, selecting "Add", then "Threads (Users)", and finally, "Thread Group.”
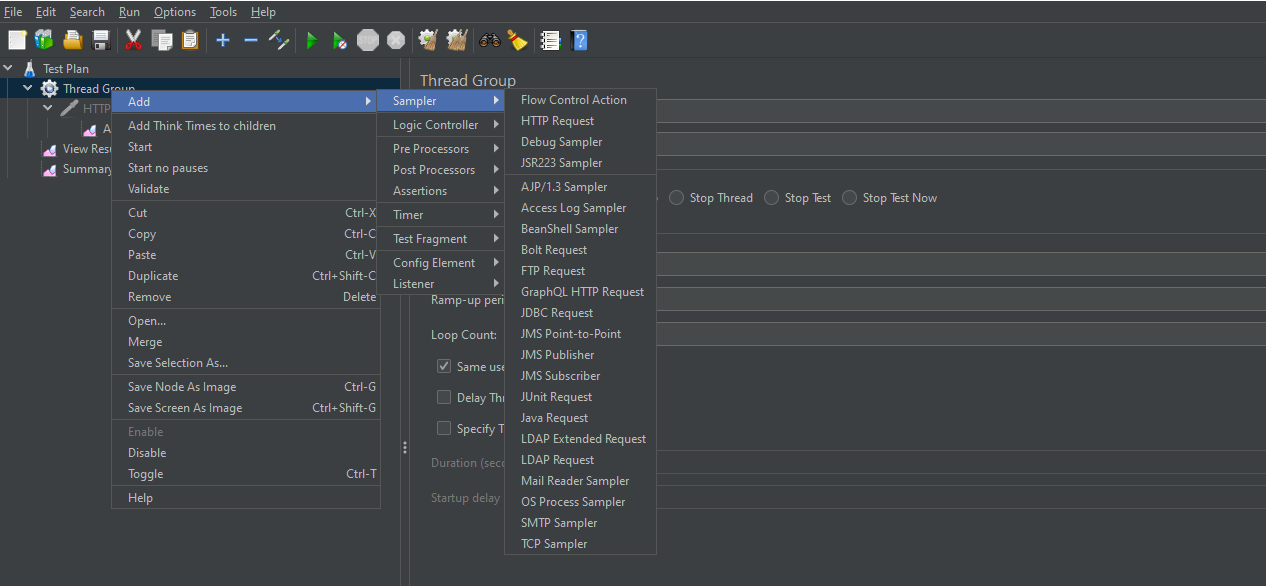
- Add a Sampler: In JMeter, a "Sampler" is a request you send to a server. You can add a sampler by right-clicking on the Thread Group you created, then selecting "Add", then "Sampler", and finally the type of request you want to send (for example, "HTTP Request"
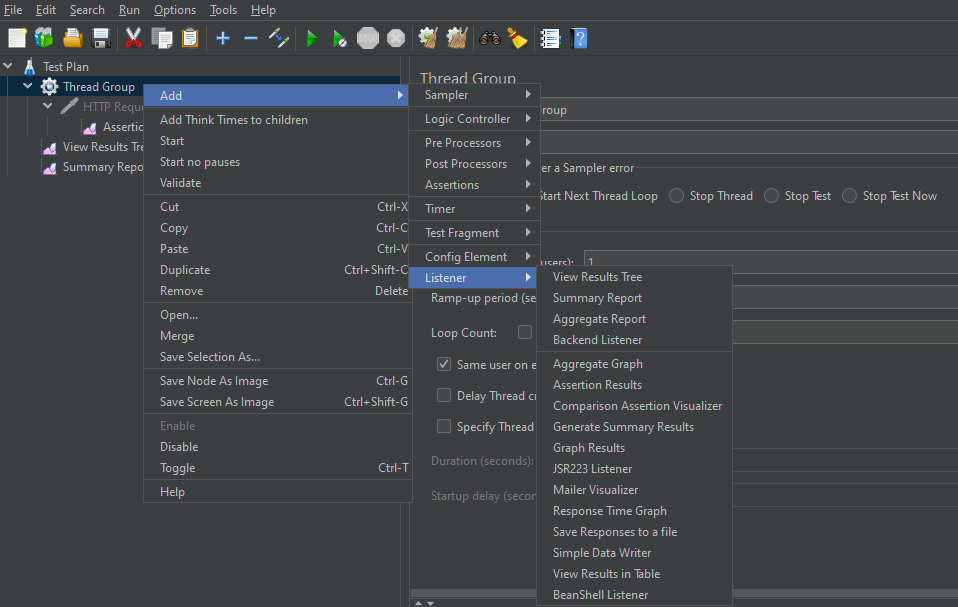
- Add a Listener: Listeners are used in JMeter to view the results of your test execution. You can add a listener by right-clicking on your test plan, then selecting "Add", then "Listener", and finally the type of listener you want to add (for example, "View Results in Tab
- Run your Test Plan: Once you have set up your test plan, you can run it by clicking the "Run" button in the JMeter toolbar.
Designing and Executing Performance Test Scenarios
Designing performance test scenarios involves defining what actions will be performed, by how many virtual users, and for how long. It's crucial to design test scenarios that closely mimic real-world usage of the application.
For example, in a load test, you might configure JMeter to simulate 1000 users logging into your application over 10 minutes. In a stress test, you might increase this number to 10,000 users over 1 minute to see how the application handles extreme loads.
Executing the test scenarios involves running the tests in JMeter and collecting the results. JMeter provides several types of listeners to view and save test results, including tables, graphs, and tree views.
Integrating JMeter with Apidog for Performance Testing
Here is a detailed step-by-step guide for integrating JMeter with Apidog for performance testing.
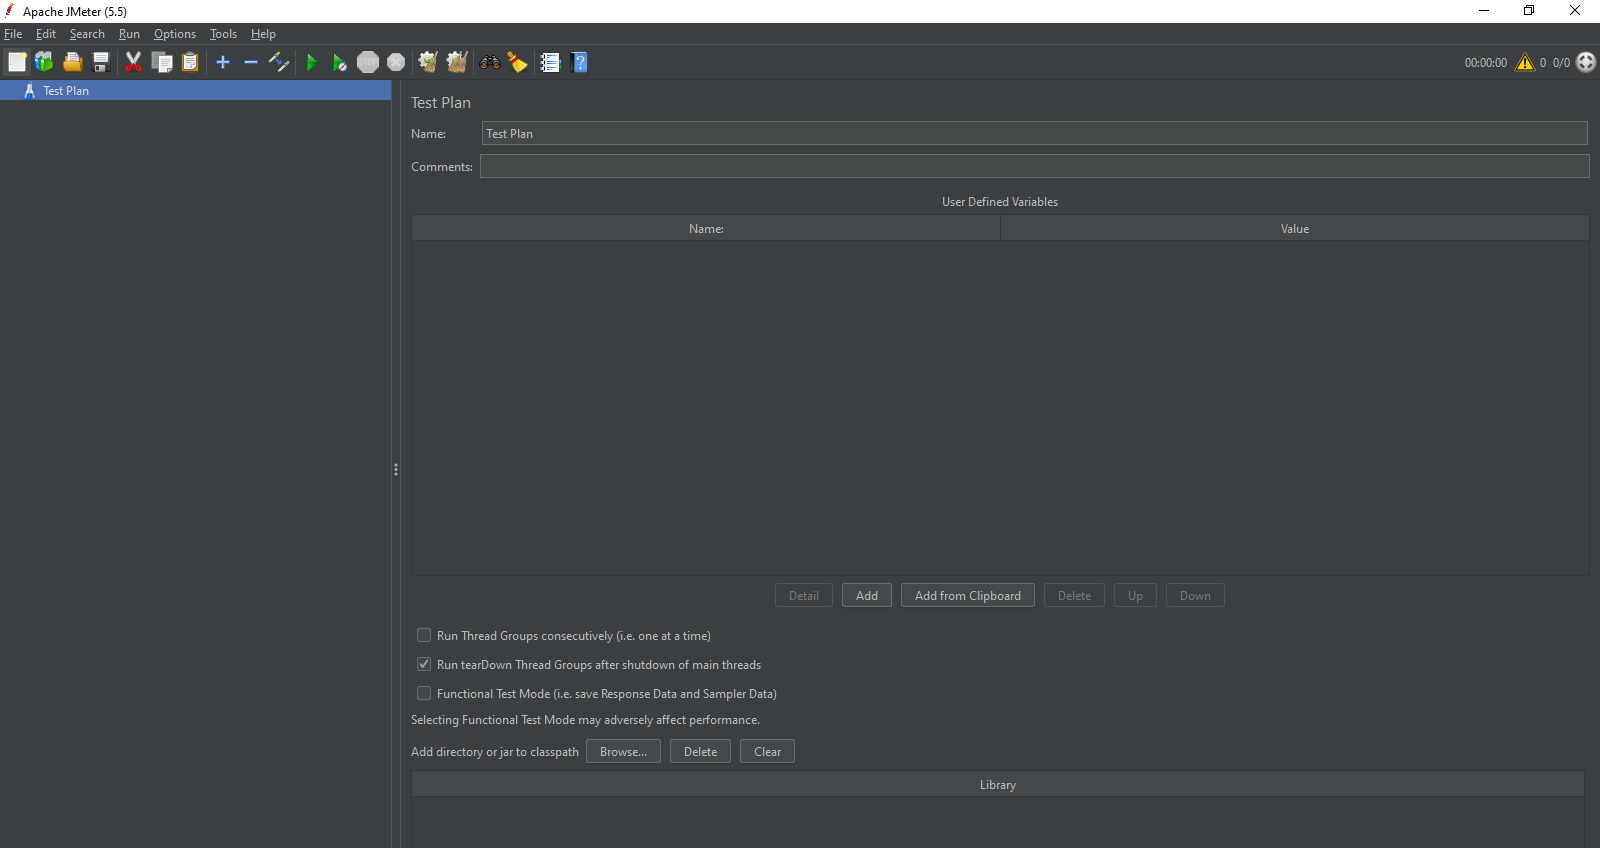
Step 1: Creating a Test Plan in JMeter
- Open JMeter.
- In the tree structure on the left, right-click on "Test Plan" and go to "Add" -> "Threads (Users)" -> "Thread Group".
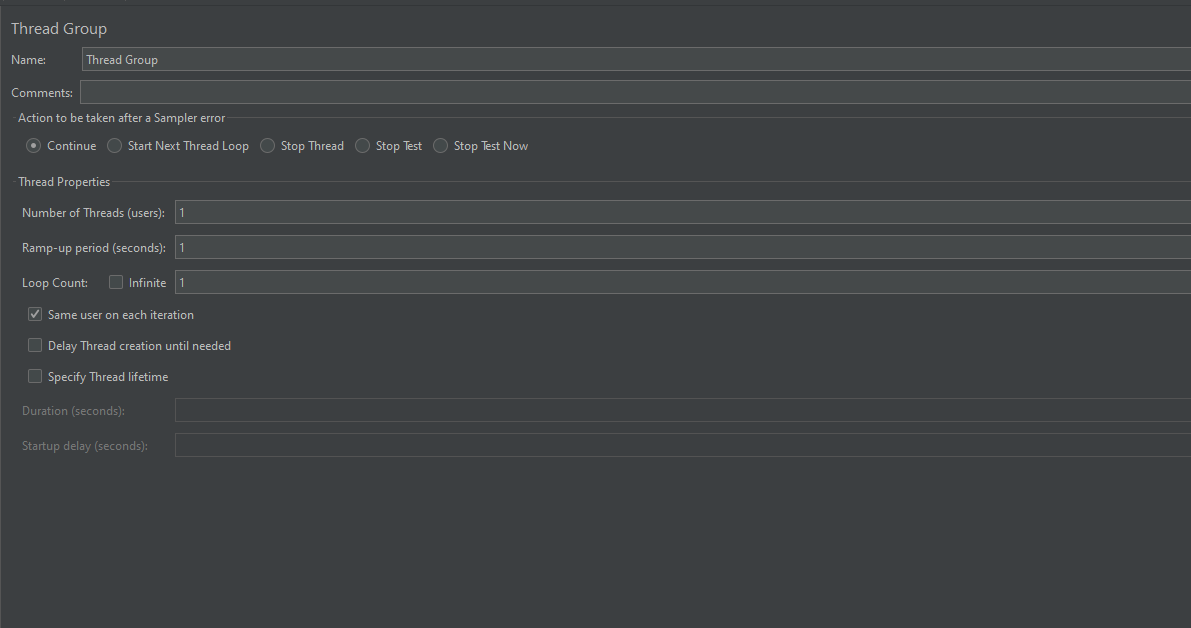
- Adjust the number of threads (users), loop count, and ramp-up period based on your testing needs.
- Right-click on the "Thread Group" you just created, and go to "Add" -> "Sampler" -> "HTTP Request".
- In the HTTP Request, fill in the details of the server (e.g., Server Name or IP, Protocol, Path, etc.) you want to test.
- Once you have configured your test plan, you can save it by clicking on "File" -> "Save" (or "Save Test Plan as"). Make sure to save it as a .jmx file.
Here is an example XML file (.jmx file extension), which you can import in Apidog for demo testing:
<?xml version="1.0" encoding="UTF-8"?>
<jmeterTestPlan version="1.2" properties="5.0" jmeter="5.5">
  <hashTree>
    <TestPlan guiclass="TestPlanGui" testclass="TestPlan" testname="Test Plan" enabled="true">
      <stringProp name="TestPlan.comments"></stringProp>
      <boolProp name="TestPlan.functional_mode">false</boolProp>
      <boolProp name="TestPlan.serialize_threadgroups">false</boolProp>
    </TestPlan>
    <hashTree>
      <ThreadGroup guiclass="ThreadGroupGui" testclass="ThreadGroup" testname="Thread Group" enabled="true">
        <stringProp name="ThreadGroup.on_sample_error">continue</stringProp>
        <elementProp name="ThreadGroup.main_controller" elementType="LoopController" guiclass="LoopControlPanel" testclass="LoopController" testname="Loop Controller" enabled="true">
          <boolProp name="LoopController.continue_forever">false</boolProp>
          <stringProp name="LoopController.loops">1</stringProp>
        </elementProp>
        <stringProp name="ThreadGroup.num_threads">1</stringProp>
        <stringProp name="ThreadGroup.ramp_time">1</stringProp>
        <boolProp name="ThreadGroup.scheduler">false</boolProp>
        <stringProp name="ThreadGroup.duration"></stringProp>
        <stringProp name="ThreadGroup.delay"></stringProp>
        <boolProp name="ThreadGroup.same_user_on_next_iteration">true</boolProp>
      </ThreadGroup>
      <hashTree>
        <HTTPSamplerProxy guiclass="HttpTestSampleGui" testclass="HTTPSamplerProxy" testname="HTTP Request" enabled="false">
          <elementProp name="HTTPsampler.Arguments" elementType="Arguments" guiclass="HTTPArgumentsPanel" testclass="Arguments" enabled="true">
            <collectionProp name="Arguments.arguments"/>
          </elementProp>
          <stringProp name="HTTPSampler.domain">httpbin.org</stringProp>
          <stringProp name="HTTPSampler.port"></stringProp>
          <stringProp name="HTTPSampler.protocol">http</stringProp>
          <stringProp name="HTTPSampler.contentEncoding"></stringProp>
          <stringProp name="HTTPSampler.path">/get</stringProp>
          <stringProp name="HTTPSampler.method">GET</stringProp>
          <boolProp name="HTTPSampler.follow_redirects">false</boolProp>
          <boolProp name="HTTPSampler.auto_redirects">false</boolProp>
          <boolProp name="HTTPSampler.use_keepalive">false</boolProp>
          <boolProp name="HTTPSampler.DO_MULTIPART_POST">false</boolProp>
          <stringProp name="HTTPSampler.embedded_url_re"></stringProp>
          <stringProp name="HTTPSampler.connect_timeout"></stringProp>
          <stringProp name="HTTPSampler.response_timeout"></stringProp>
        </HTTPSamplerProxy>
        <hashTree/>
      </hashTree>
    </hashTree>
  </hashTree>
</jmeterTestPlan>
Step 2: Importing the JMeter Test Plan to Apidog
- Register an Account: Open Apidog and register a new account using your email.
2. Create a Workspace: After logging in, create a team workspace. This is where you will create your projects and import your test plans. You can invite other team members to join your workspace if needed.
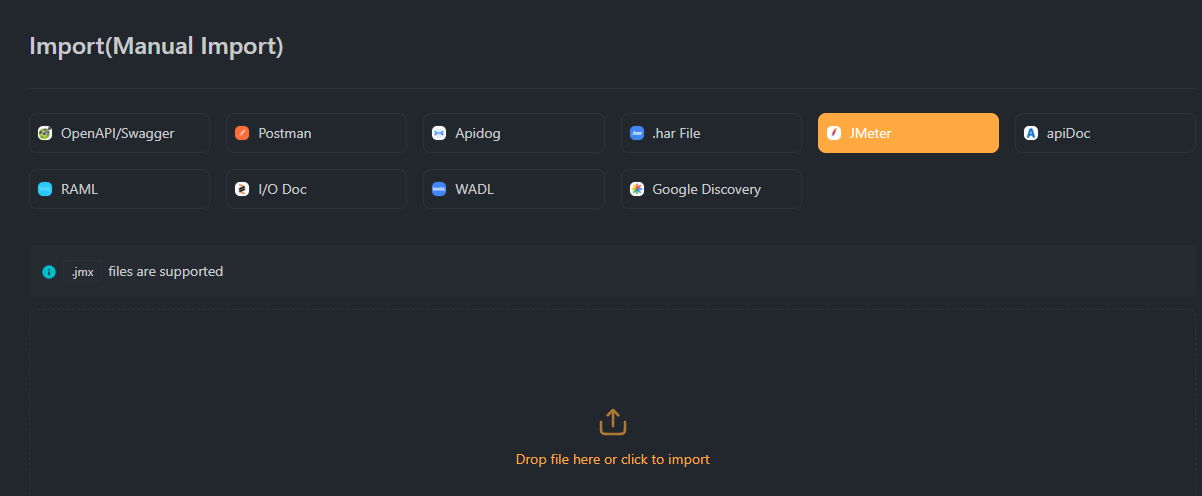
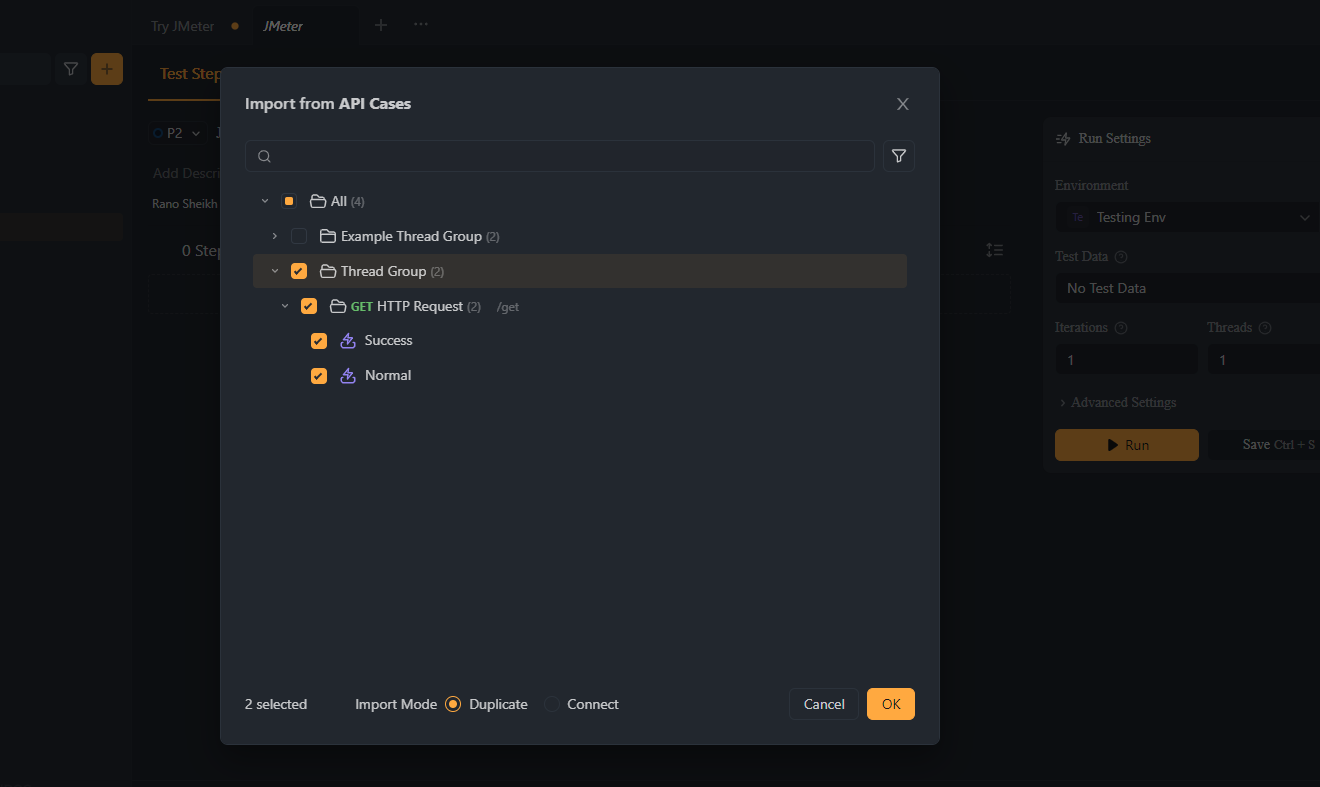
3. Import the Test Plan: Navigate to your project's "Import" tab
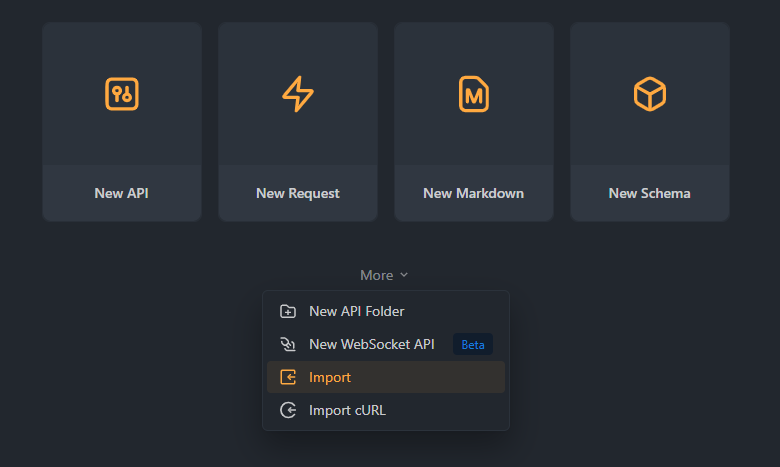
4. Select "JMeter" and upload the file.

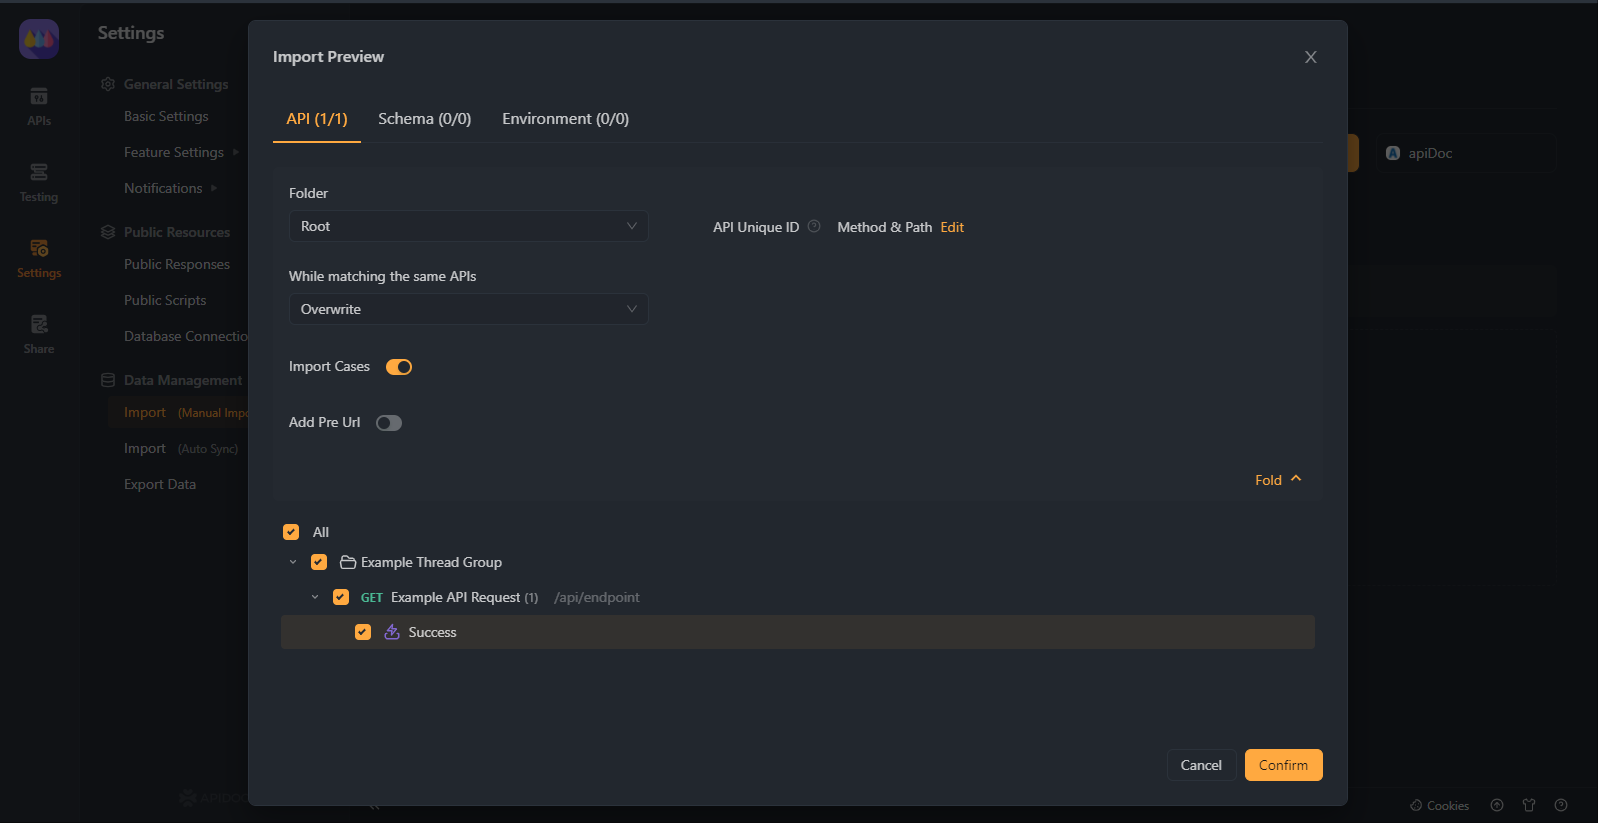
5. Click "Confirm". Select the .jmx file you saved earlier and click "Open"
Step 3: Running the Test in Apidog
- Navigate to the Project: Go to your imported project after successfully importing the JMeter test plan.
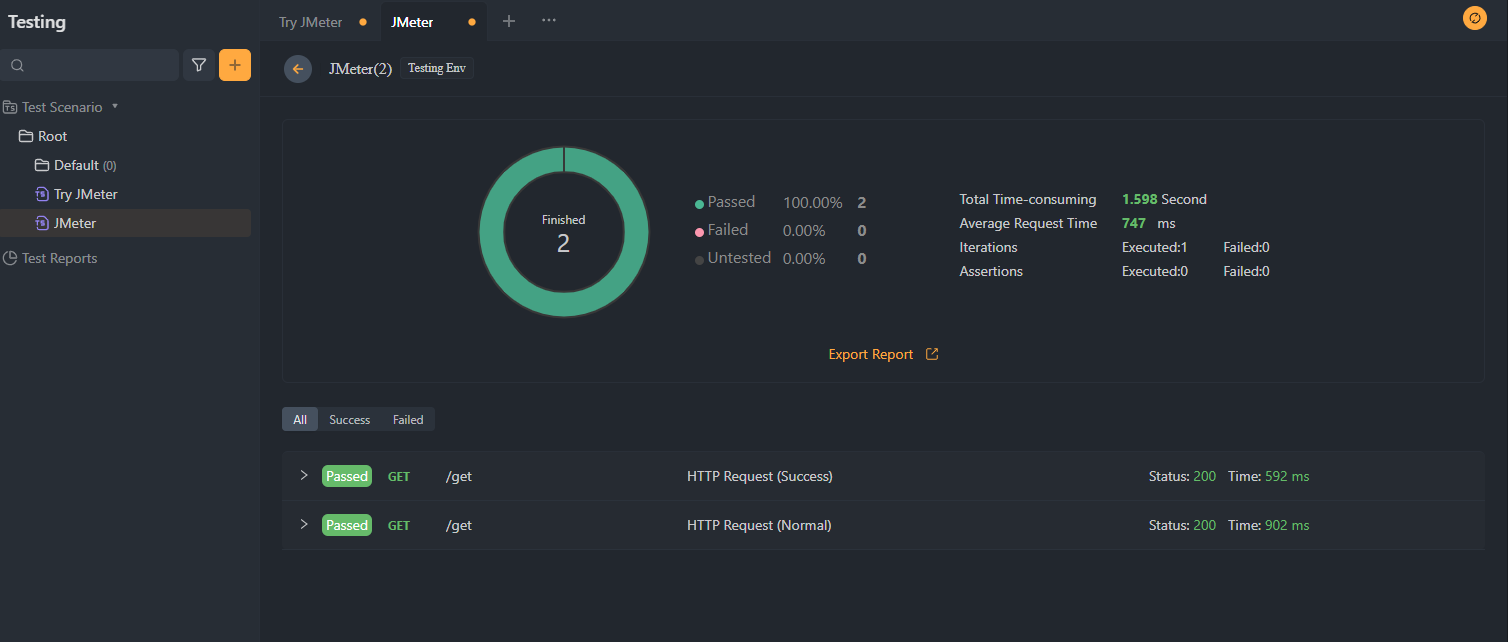
- Run the Test: Start the performance test by clicking the "Run" button. Apidog will now execute the test plan you imported from JMeter.
3. Monitor the Test: You can monitor the test progress and results in real-time within Apidog. This includes response times, error rates etc
Remember, performance testing is not a one-time task but should be a regular part of your development and deployment process to ensure the optimal performance of your API.
Conclusion
To summarise, JMeter is a powerful tool for performing performance testing on your APIs designed with Apidog. The ability to export test cases from Apidog and import them into JMeter makes it easy to incorporate performance testing into your API development process. Moreover, using JMeter tests in your continuous integration process helps ensure that the performance of your API remains consistent as it evolves.
With the combination of Apidog for API design and JMeter for performance testing, you can ensure your APIs are well-designed and high-performing.
So, start testing your APIs with JMeter and Apidog today and take the first step towards building reliable, high-performing APIs!


