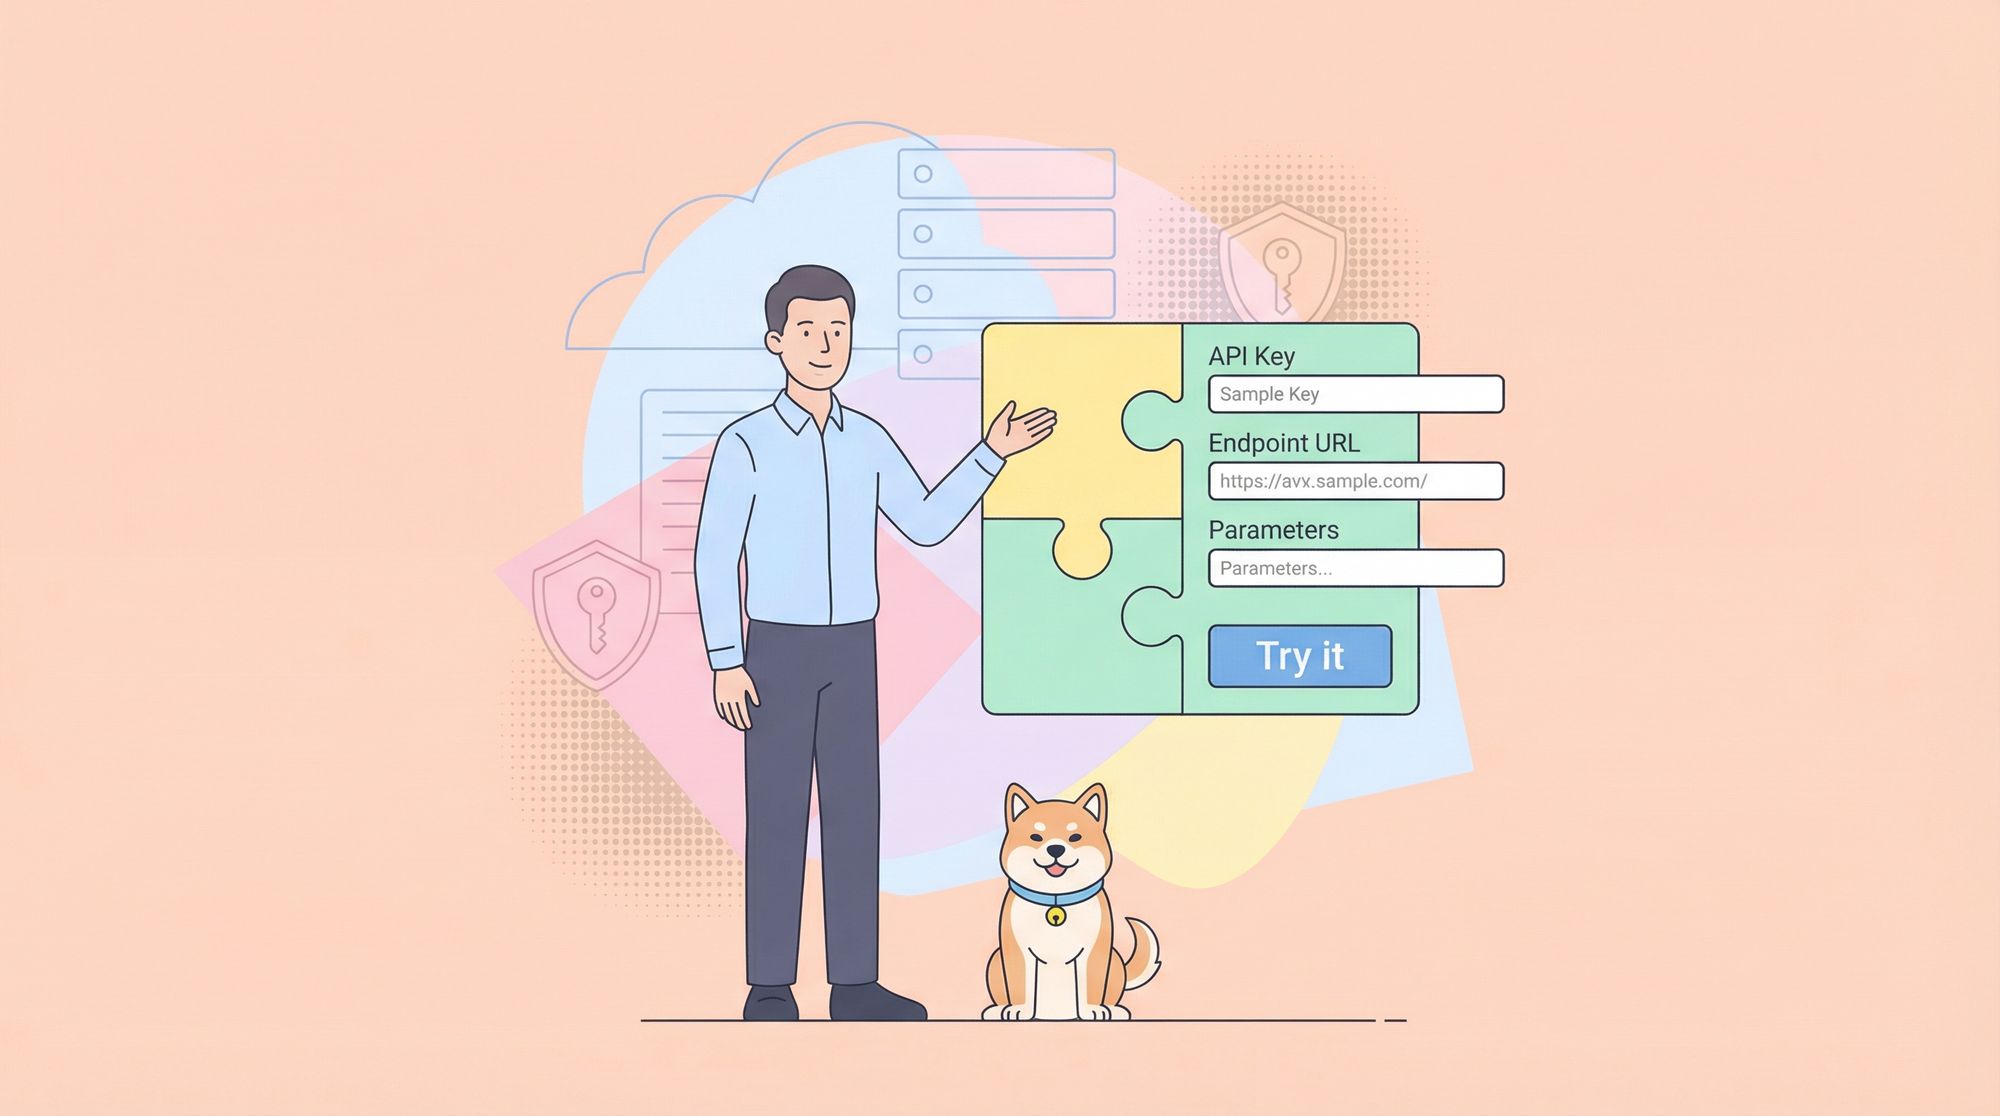
When you open an online API document published using Apidog, you'll notice a "Try it" button next to each endpoint. Clicking it slides out a debug panel on the right side of the page, allowing you to test the API directly within the documentation.

However, the usability of this "Debug" feature largely depends on how well you've configured it within the platform. Factors like proper URL setup, authentication configuration, clear parameter structure, and complete example data significantly impact the debugging experience.
If not configured properly, users may spend a lot of time filling in parameters or even fail to make successful API calls, which is far from ideal.
Let's discuss how to configure Apidog effectively to ensure the published online documentation provides an excellent debugging experience.
Proper URL Configuration
Often, online documentation looks fine but fails when you click the "Try it" button to send a request. The most common reason is that the endpoint only includes a path like /pet/{petId} without selecting a runtime environment during publication.

This results in incomplete request URLs without a protocol or hostname, leading to errors when sending requests.

To address this, ensure users can access the correct URL. Apidog offers three ways to configure URLs for online documentation, depending on your needs.
1. Use Base URLs
This is the recommended approach. Define only the path in the endpoint, such as /pet/{petId}, and configure the full service address (e.g., https://product.example.com) in the "Environment Management" section as a Base URL.

When publishing the API documentation, select the appropriate runtime environment. Apidog will automatically concatenate the Base URL with the endpoint path. You can also define multiple runtime environments, each with its own Base URL.

In the online documentation, users can quickly switch environments from a dropdown list, and all endpoint URLs will update accordingly. This makes it convenient to validate APIs in different environments.

Note: Be mindful of protocol issues. Many browsers restrict HTTPS pages from calling HTTP APIs. If your API uses HTTP, users may encounter cross-protocol issues when debugging on an HTTPS documentation page.
2. Include Full URLs in Endpoints
Another option is to specify the full URL directly in the endpoint, such as https://product.example.com/pet/{petId}.

This ensures the complete request URL is visible regardless of the selected runtime environment. However, managing changes to server addresses becomes cumbersome as you'll need to update each endpoint individually. Hence, this method is less recommended.

3. Use Variables in URLs
If you want users to customize the URL for debugging, you can use variables. For example, create an environment variable BaseURL in the "Environment Management" section and reference it in the Base URL as {{BaseURL}}.

In the online documentation, users can click the variable name and modify it to their desired URL.

Alternatively, you can define variables directly in the endpoint, such as {{BaseURL}}/pet/{petId}.

For that specific endpoint in the online documentation, users can set the value of the variable to send the request.

Before publishing the documentation, ensure that the "initial values" in the environment do not contain sensitive information (e.g., authentication credentials), as these values will be included in the published documentation and may pose privacy risks.
Proper Auth Configuration
Basic Auth Setup
Successful endpoint requests often require auth. Apidog supports various auth types, including Bearer Token, API Key, OAuth2.0, and Basic Auth.
You can configure auth at the endpoint or folder level using a security scheme or by setting it manually.

For example, when using Bearer Token as the auth type, a "Token" field appears at the top of the debug panel in the online documentation. Users can input the token value directly without manually adding the "Bearer" prefix. Apidog handles this automatically, making it more convenient than adding an authorization header manually.

The advantage of this setup is that authentication information can be shared across multiple endpoints. If several endpoints use the same security scheme or type, you only need to input the credentials once. Any updates to the credentials will automatically apply to all associated endpoints.

Authentication credentials are encrypted and stored locally in the user's browser, managed per session, and shared across tabs and windows. They are cleared when the browser is closed, reducing the risk of exposing sensitive information in published documentation.
OAuth2.0 Configuration
For OAuth2.0 authentication, if you want users to generate tokens directly during debugging, configure the authorization server details (e.g., Auth URL, Token URL) in the project.

When using the OAuth2.0 security scheme, users will need to input the client ID, client secret, etc., during debugging. A pop-up will guide them through the authorization process, and the obtained access_token will be automatically applied to subsequent API requests.

Design Clear Parameter Structures
Parameter Display in Debug Panel
The debug panel intelligently displays parameter sections based on your endpoint design. For instance, if the endpoint only defines Path parameters, the debug panel will only show the Path section, avoiding unnecessary Query or Body sections.

This clarity helps users understand which parameters to fill in without being distracted by irrelevant sections.
Provide Example
When designing endpoints, define each parameter's type and required attributes accurately. Include clear descriptions and examples, as these will be pre-filled in the debug panel, improving usability.

Avoid Redundant Headers
If the endpoint defines Body parameters, there's no need to manually add headers like Content-Type: application/json. Apidog automatically handles such headers during requests.

Similarly, if auth is configured, avoid duplicating it in headers. Auth settings take precedence and will override any conflicting header configurations.

Offer Comprehensive Request Examples
For endpoints with complex JSON request bodies, provide multiple request body examples during design.

Users can select these examples from a dropdown menu in the debug panel, saving time and reducing errors.

Ensure example data closely resembles real-world scenarios, but avoid including sensitive information. Users can modify these examples as needed.
Configure Clear Response Examples
After sending a request, the debug panel displays the full response, including status codes, headers, and body. As a documentation creator, configure clear response examples to help users understand the possible outcomes.

Provide multiple response examples for each endpoint, such as success (200), bad request (400), and unauthorized (401).

Pay special attention to error responses, clearly explaining the error codes and message formats for different scenarios. This helps users quickly identify and resolve issues during debugging.
Provide Example Code for Integration
While Apidog automatically generates example code for common programming languages, the generated code may not fully align with your business needs. In such cases, customize the examples.
You can configure which languages require auto-generated examples in "Project Settings -> Endpoint Feature Settings-> Request Code Samples."

Additionally, you can write custom example code for specific endpoints in the "Endpoint Description" section.

This ensures users see both auto-generated and custom examples in the online documentation, making integration easier.
Summary
The debugging experience of online documentation heavily depends on proper configuration. By setting up URLs, authentication, parameter structures, and examples thoughtfully, you can ensure users quickly get started with your API without being bogged down by technical details.


