
In the fast-paced world of real-time web applications, Socket.IO. stands as a cornerstone technology enabling bidirectional communication between clients and servers. Yet, with great power comes the inevitable debugging challenges that can make even seasoned developers pull their hair out! 😩
Whether you're building chat applications, live dashboards, or collaborative tools, effective debugging is crucial for maintaining sanity and shipping reliable code. This comprehensive guide explores both built-in Socket.IO debugging capabilities and introduces Apidog's Socket.IO debugging tool that's changing the game for developers everywhere.
Let's dive in and transform those debugging nightmares into smooth sailing! 🚀
Understanding Socket.IO's Built-in Debugging Capabilities
Socket.IO comes equipped with powerful yet often overlooked debugging capabilities that can save hours of troubleshooting. At its core, Socket.IO leverages the minimalistic but incredibly powerful debug module created by TJ Holowaychuk.
Prior to Socket.IO 1.0, the server would output everything to the console by default—helpful for some, but overwhelmingly verbose for many. The current approach is much more elegant: complete silence by default, with opt-in debugging through environment variables or localStorage properties.
The fundamental concept is brilliantly simple: each Socket.IO module provides different debugging scopes that offer insights into its internal workings. Developers can selectively enable these scopes to get precisely the information they need without drowning in irrelevant logs.
Enabling Socket.IO Debugging in Node.js Applications
To activate debugging in a Node.js environment, developers can use the DEBUG environment variable. The syntax is straightforward yet flexible:
# Enable all debugging output
DEBUG=* node yourfile.js

# Focus only on Socket.io client-related messages
DEBUG=socket.io:client* node yourfile.js

# See both Engine.IO and Socket.io messages
DEBUG=engine,socket.io* node yourfile.js
This approach provides granular control over what information appears in the console. For complex applications with numerous Socket.IO connections, this filtering capability becomes invaluable—allowing developers to focus on specific components without noise from unrelated parts of the system.
Implementing Browser-Side Socket.IO Debugging
For client-side debugging in browsers, the mechanism works similarly but uses localStorage instead of environment variables:
// Enable all debugging
localStorage.debug = '*';

// Focus on specific Socket.io components
localStorage.debug = 'socket.io:client*';

// Clear all debug settings
localStorage.debug = '';
After setting these values, refreshing the page will activate the specified debug output in the browser console. This proves especially useful when troubleshooting connection issues or investigating event handling problems in the client application.
Creating Custom Debugging Middleware for Socket.IO
For more advanced debugging needs, developers often implement custom middleware to intercept and log Socket.IO events. This approach provides greater flexibility and can be tailored to specific application requirements:
// Server-side custom debugging middleware
io.use((socket, next) => {
  // Log all incoming events
  const originalOnEvent = socket.onevent;
  socket.onevent = function(packet) {
    const args = packet.data || [];
    console.log(`[${new Date().toISOString()}] INCOMING [${socket.id}]: ${args[0]}`,
      JSON.stringify(args.slice(1)));
    originalOnEvent.call(this, packet);
  };

  // Log all outgoing events
  const originalEmit = socket.emit;
  socket.emit = function(event, ...args) {
    if (event !== 'newListener') {  // Filter out internal events
      console.log(`[${new Date().toISOString()}] OUTGOING [${socket.id}]: ${event}`,
        JSON.stringify(args));
    }
    return originalEmit.apply(this, [event, ...args]);
  };

  next();
});
This middleware approach offers several advantages:
- Timestamp information for precise event sequencing
- Socket ID context to track specific client connections
- Formatted output for improved readability
- Selective filtering of internal events
By implementing such middleware, development teams gain comprehensive visibility into the flow of events through their Socket.IO application, making it significantly easier to identify and resolve issues.
Advanced Socket.IO Debugging Techniques Using Code
Beyond basic logging, experienced developers employ several sophisticated techniques to debug Socket.IO applications effectively. These approaches leverage both Socket.IO's internal capabilities and external tools to provide deeper insights into application behavior.
Event Acknowledgement for Verification
Socket.IO's acknowledgement mechanism serves as an excellent debugging tool. By using callbacks with emitted events, developers can verify that messages are received and processed correctly:
// Client-side with acknowledgement
socket.emit('update-profile', { name: 'Alex' }, (response) => {
  console.log('Server acknowledged profile update:', response);
  if (response.error) {
    console.error('Error updating profile:', response.error);
  }
});

// Server-side handling with acknowledgement
socket.on('update-profile', (data, callback) => {
  try {
    // Process the profile update
    updateUserProfile(socket.userId, data);
    callback({ success: true });
  } catch (error) {
    console.error('Profile update error:', error);
    callback({ error: error.message });
  }
});
This pattern creates a closed feedback loop that makes it immediately apparent when messages aren't being processed as expected. The acknowledgement serves as both a debugging tool during development and a reliability mechanism in production.
Creating Socket.IO Monitoring Dashboards
For applications with complex real-time requirements, developers sometimes create dedicated monitoring dashboards that visualize Socket.IO connections and events:
// Server-side monitoring endpoint
app.get('/socket-monitor', (req, res) => {
  const connectedSockets = Object.keys(io.sockets.sockets).length;
  const roomSizes = {};

  // Collect room information
  for (const [roomName, room] of io.sockets.adapter.rooms.entries()) {
    if (!roomName.match(/^[^/]/)) {  // Filter out socket IDs
      roomSizes[roomName] = room.size;
    }
  }

  // Return monitoring data
  res.json({
    connections: {
      current: connectedSockets,
      peak: global.peakConnections || connectedSockets
    },
    rooms: roomSizes,
    uptime: process.uptime()
  });
});

// Track peak connections
io.on('connection', (socket) => {
  const currentConnections = Object.keys(io.sockets.sockets).length;
  global.peakConnections = Math.max(global.peakConnections || 0, currentConnections);
  // Other connection handling
});
Such dashboards provide valuable real-time insights into application health and usage patterns, making it easier to identify issues like connection leaks or unexpected room growth.
Socket.IO Event Replay for Testing
Another powerful debugging technique involves recording and replaying Socket.IO events to reproduce and diagnose issues:
// Record events for replay
const eventLog = [];
io.on('connection', (socket) => {
  // Record incoming events
  socket.onAny((event, ...args) => {
    eventLog.push({
      timestamp: Date.now(),
      socketId: socket.id,
      direction: 'incoming',
      event,
      args
    });
  });

  // Record outgoing events
  const originalEmit = socket.emit;
  socket.emit = function(event, ...args) {
    if (!event.startsWith('internal:')) {
      eventLog.push({
        timestamp: Date.now(),
        socketId: socket.id,
        direction: 'outgoing',
        event,
        args: args.slice(0, -1)  // Remove callback if present
      });
    }
    return originalEmit.apply(this, [event, ...args]);
  };
});

// Endpoint to retrieve recorded events
app.get('/debug/socket-events', (req, res) => {
  res.json(eventLog);
});

// Endpoint to replay events for testing
app.post('/debug/replay-events', (req, res) => {
  const { events, targetSocketId } = req.body;
  const targetSocket = io.sockets.sockets.get(targetSocketId);

  if (!targetSocket) {
    return res.status(404).json({ error: 'Target socket not found' });
  }

  // Replay the events
  events.forEach(event => {
    if (event.direction === 'outgoing') {
      targetSocket.emit(event.event, ...event.args);
    }
  });

  res.json({ success: true, eventsReplayed: events.length });
});
This approach is particularly valuable for reproducing complex sequences of events that lead to hard-to-diagnose bugs, especially in multi-user scenarios.
Common Socket.IO Debugging Challenges and Solutions
Despite the available tools, Socket.IO debugging presents unique challenges that require specific approaches. Here are some common issues and their solutions:
Connection Establishment Problems
When Socket.IO connections fail to establish, the issue often lies in the handshake process. A systematic debugging approach includes:
- Verify transport compatibility: Check if WebSocket is available or if fallback transports are working
- Examine network conditions: Look for firewalls, proxies, or CORS issues
- Inspect handshake parameters: Ensure authentication tokens and cookies are correctly configured
// Enhanced connection debugging
const socket = io('https://example.com', {
  transports: ['websocket', 'polling'],  // Try WebSocket first, then polling
  reconnectionAttempts: 3,               // Limit reconnection attempts for faster feedback
  timeout: 5000,                         // Shorter timeout for quicker error detection
  auth: { token: 'user-auth-token' },    // Authentication data
  query: { version: 'v1.2.3' },          // Query parameters
  debug: true                            // Enable built-in debugging
});

// Detailed connection event handling
socket.on('connect', () => {
  console.log('Connected with ID:', socket.id);
  console.log('Transport used:', socket.io.engine.transport.name);
});

socket.on('connect_error', (error) => {
  console.error('Connection error:', error);
  console.log('Connection attempts:', socket.io.engine.attempts);
});

socket.io.on('reconnect_attempt', (attempt) => {
  console.log(`Reconnection attempt ${attempt}`);
});

socket.io.on('reconnect_failed', () => {
  console.error('Failed to reconnect after maximum attempts');
});
This detailed connection monitoring provides valuable insights into what's happening during the connection process, making it easier to identify the root cause of issues.
Event Handling and Timing Issues
Asynchronous event handling in Socket.IO can lead to race conditions and timing-related bugs. Effective debugging requires:
- Event sequence logging: Track the order of events to identify unexpected patterns
- Timestamp analysis: Compare event timing to detect delays or timeouts
- State tracking: Monitor application state changes in response to events
// Event timing and state tracking
let appState = { authenticated: false, rooms: [], lastEvent: null };

socket.onAny((event, ...args) => {
  const now = Date.now();
  const timeSinceLastEvent = appState.lastEvent ? now - appState.lastEvent.time : null;

  console.log(`[${new Date(now).toISOString()}] Event: ${event}`, {
    args,
    timeSinceLastEvent,
    currentState: { ...appState }
  });

  appState.lastEvent = { event, time: now, args };
});

// Update state based on events
socket.on('authenticated', (userData) => {
  appState.authenticated = true;
  appState.user = userData;
});

socket.on('joined_room', (roomData) => {
  appState.rooms.push(roomData.roomId);
});
This approach creates a comprehensive log of events and state changes, making it much easier to identify the source of timing-related issues.
Memory Leaks and Performance Problems
Long-running Socket.IO applications can suffer from memory leaks and performance degradation. Identifying these issues requires:
- Listener tracking: Monitor event listener counts to detect potential memory leaks
- Resource monitoring: Track memory usage and connection counts over time
- Performance metrics: Measure event processing times and queue lengths
// Memory and performance monitoring
setInterval(() => {
  const memoryUsage = process.memoryUsage();
  const socketCount = Object.keys(io.sockets.sockets).length;
  const roomCount = io.sockets.adapter.rooms.size;

  console.log('Socket.io server metrics:', {
    time: new Date().toISOString(),
    memory: {
      rss: Math.round(memoryUsage.rss / 1024 / 1024) + 'MB',
      heapTotal: Math.round(memoryUsage.heapTotal / 1024 / 1024) + 'MB',
      heapUsed: Math.round(memoryUsage.heapUsed / 1024 / 1024) + 'MB'
    },
    connections: {
      current: socketCount,
      peak: global.peakConnections || socketCount
    },
    rooms: roomCount,
    eventRate: (global.eventCount - (global.lastEventCount || 0)) / 30
  });

  global.lastEventCount = global.eventCount;
}, 30000);

// Track event counts
io.on('connection', (socket) => {
  socket.onAny(() => {
    global.eventCount = (global.eventCount || 0) + 1;
  });
});
Regular monitoring helps identify trends that might indicate memory leaks or performance bottlenecks before they become critical issues.
Step-by-Step Guide to Socket.IO Debugging with Apidog
Let's explore how to use Apidog's Socket.IO debugging tool effectively:
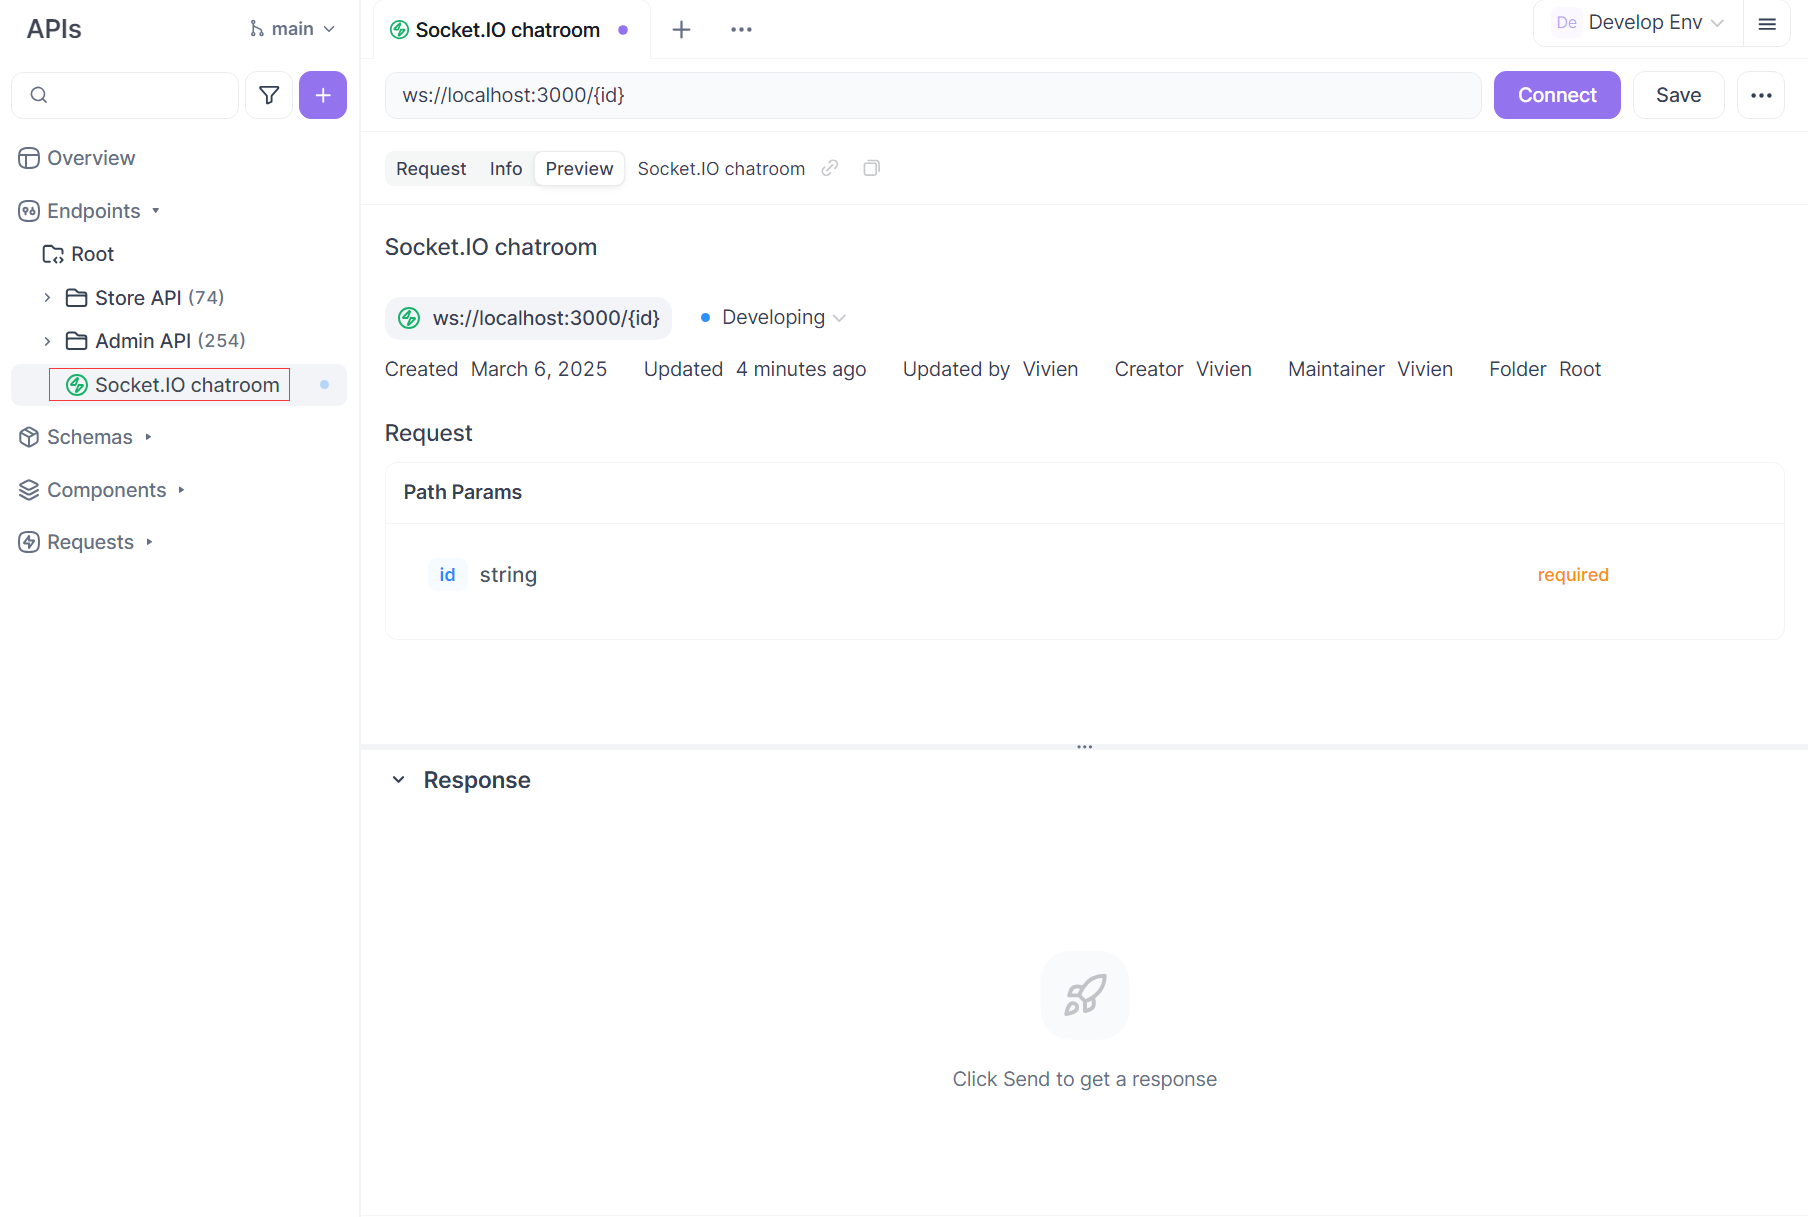
1. Creating a New Socket.IO Endpoint
Note: Apidog version 2.7.0 or higher is required for Socket.IO debugging.
a. Launch Apidog and navigate to your project
b. Create a new Socket.IO endpoint:
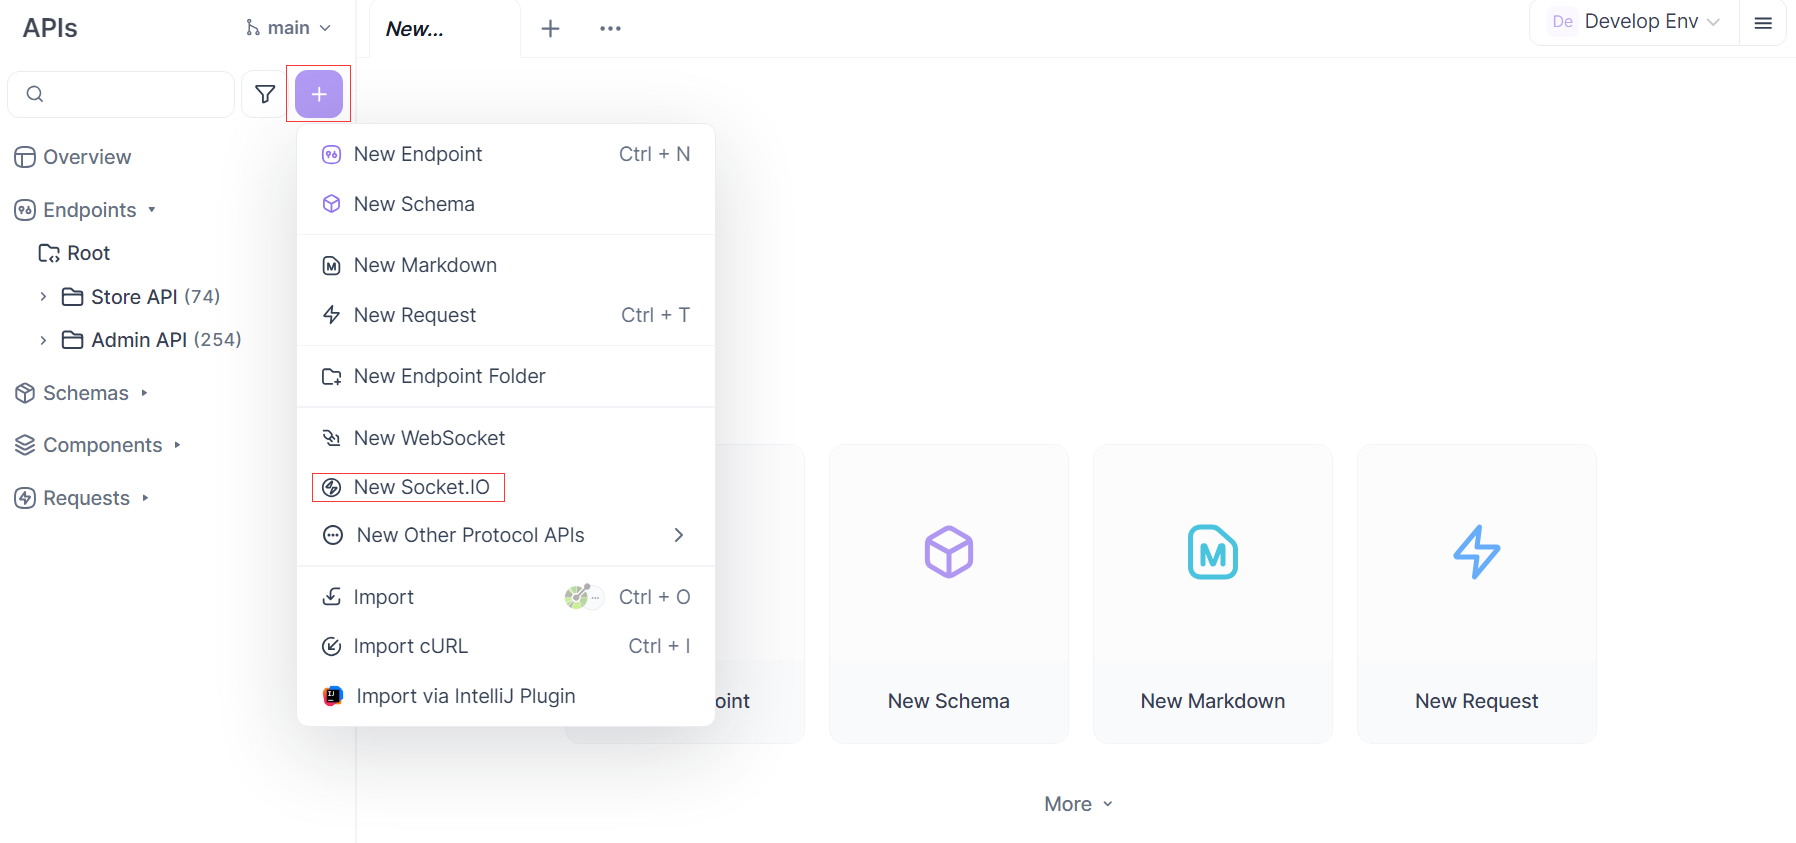
- Hover over the
+button in the left panel - Select "New Socket.IO" from the dropdown menu
c. Configure the connection:
- Enter the server address (e.g.,
ws://localhost:3000orwss://example.com) - Add any required handshake parameters in the appropriate tabs:
- URL parameters directly in the address
- Additional parameters in the "Params" tab
- Authentication headers in the "Headers" tab
- Cookies in the "Cookies" tab
2. Establishing and Monitoring the Connection
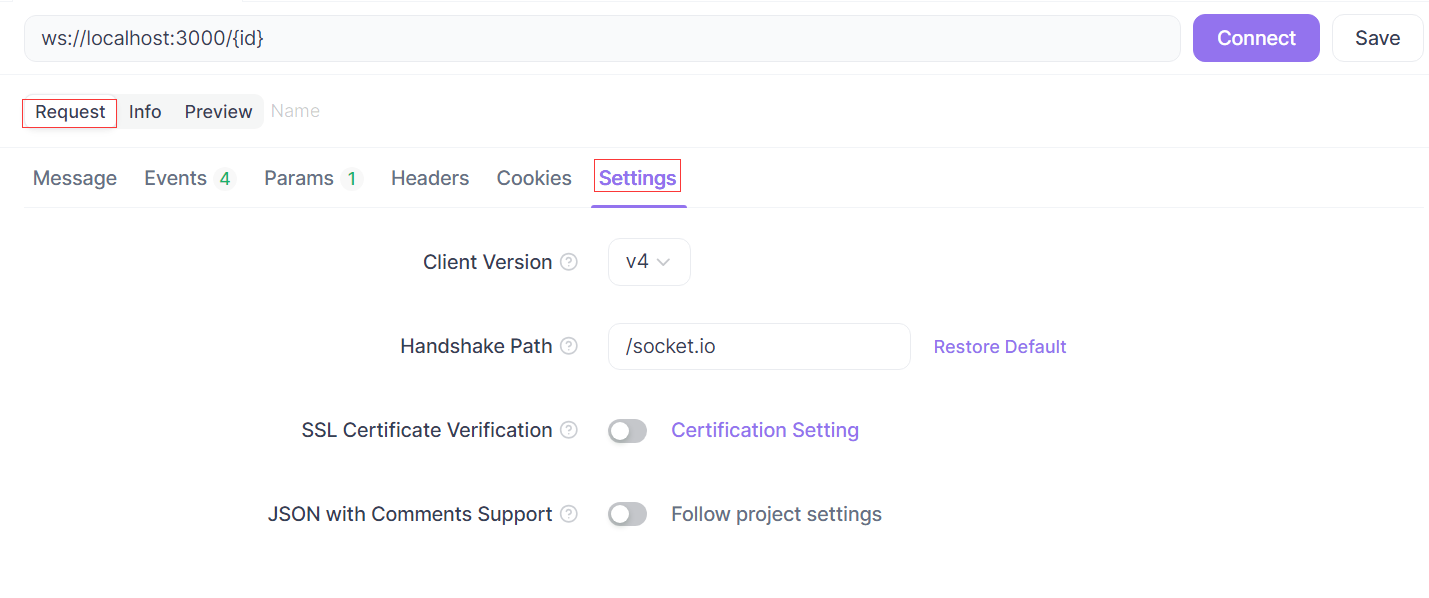
Adjust advanced settings if necessary:
- Click "Settings" under the "Request" section
- Select the appropriate client version (default is v4, but v2/v3 are supported)
- Modify the handshake path if your server uses a custom path
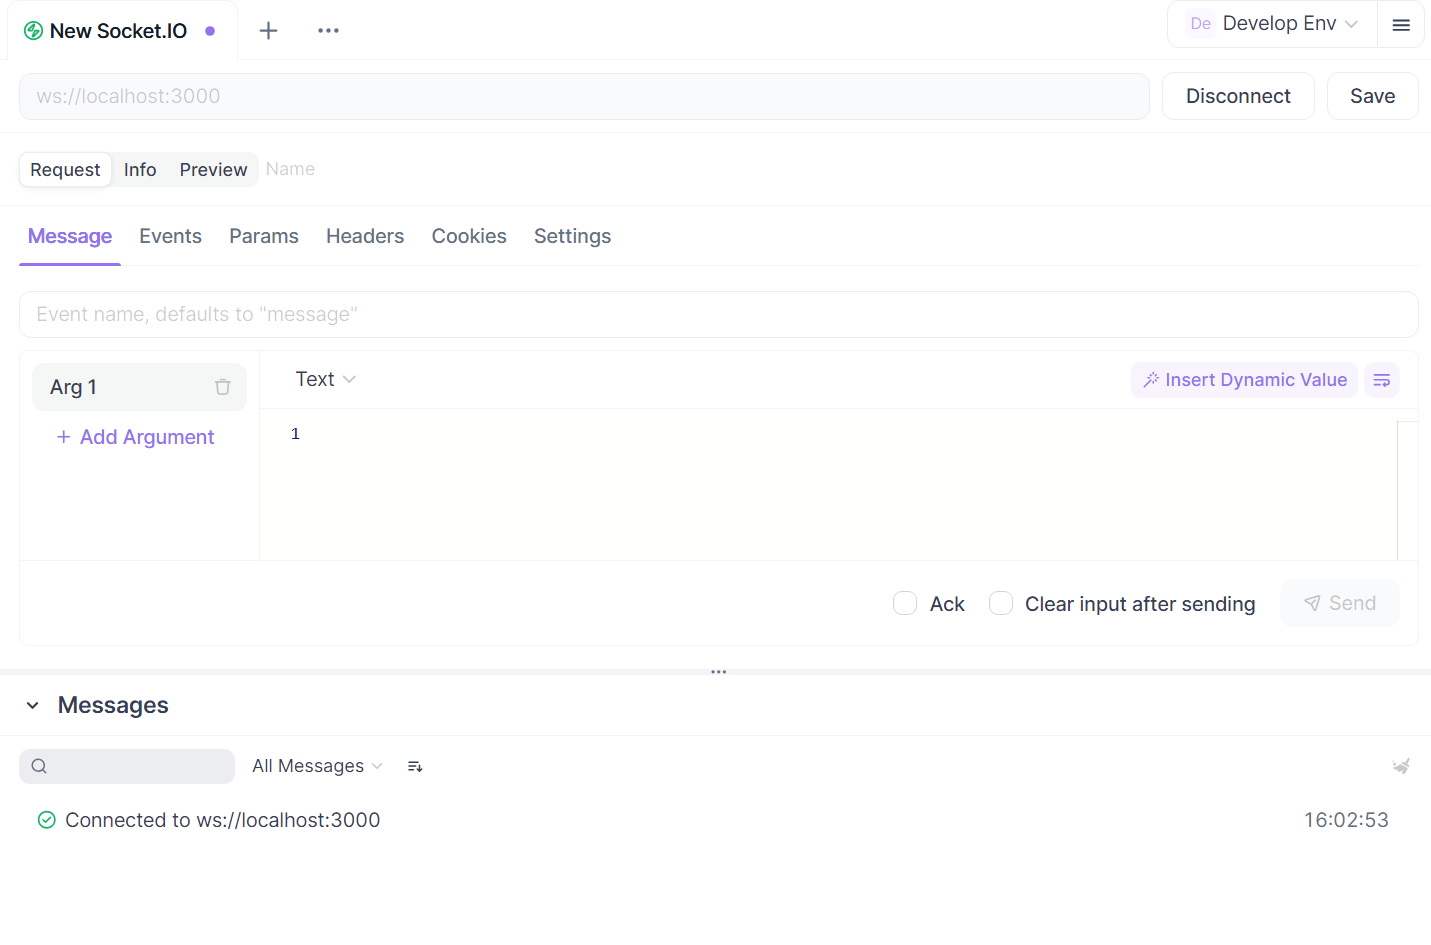
Establish the connection:
- Click the "Connect" button to initiate the Socket.IO connection
- The connection status will update to indicate success or failure
- If connection fails, check the error message for troubleshooting guidance
Observe the handshake process:
- The timeline will show the complete handshake sequence
- Examine the handshake parameters to verify authentication and transport selection
- Confirm whether the connection successfully upgrades to WebSocket
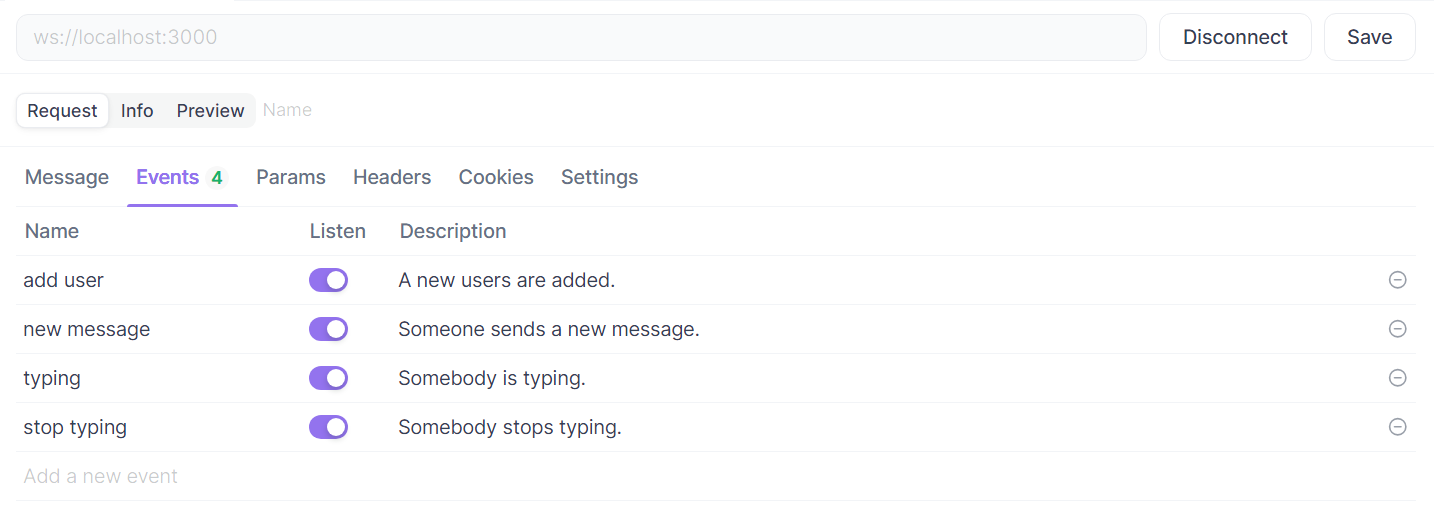
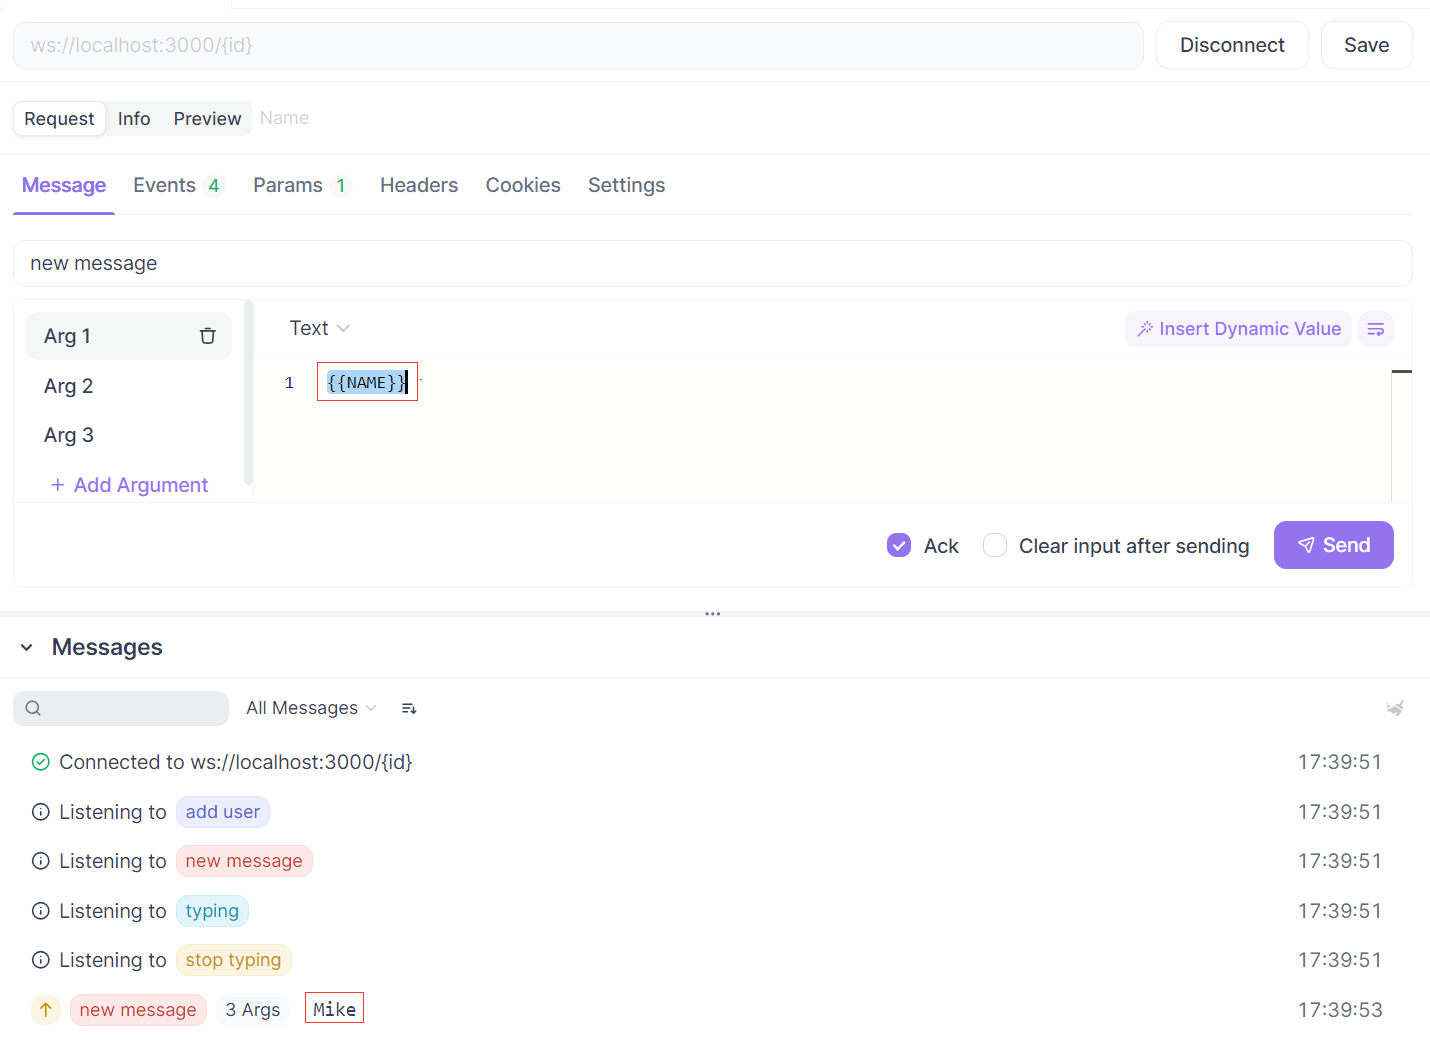
3. Working with Socket.IO Events
Listen for events:
- Navigate to the "Events" tab
- Add custom events by entering their names and enabling the "Listen" toggle
- Received events will appear in the timeline with their payloads automatically decoded
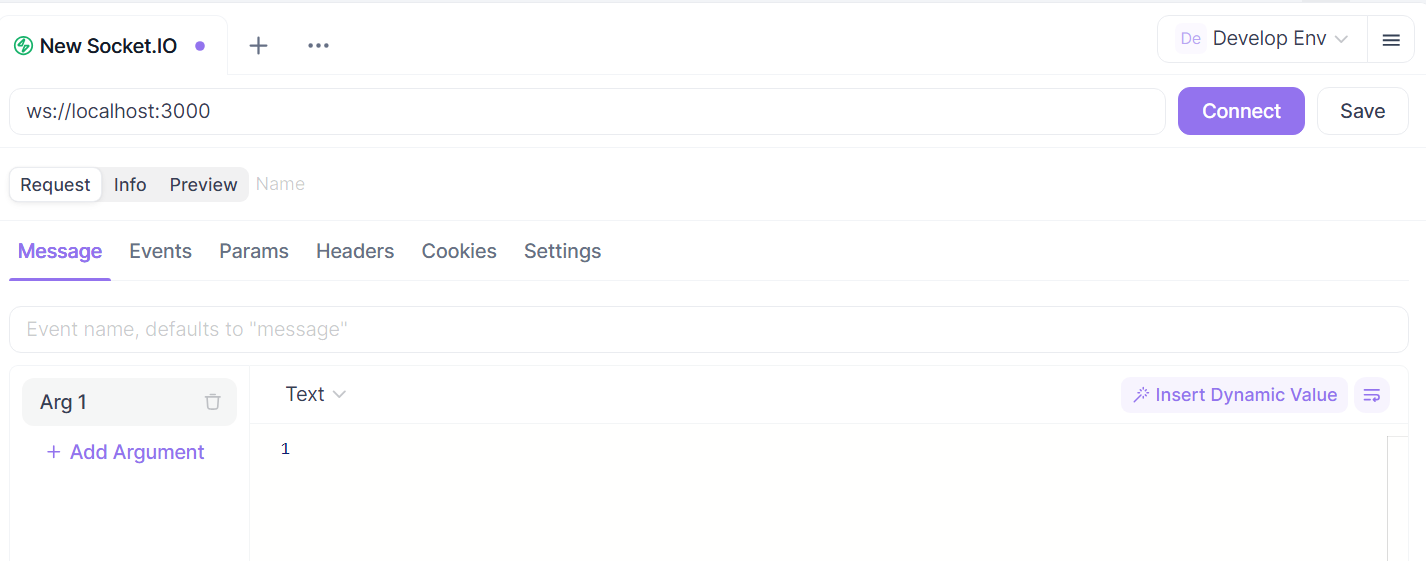
Send messages to the server:
- Set the event name (defaults to message)
- Configure the argument(s):
- Select the appropriate format (JSON, text, or Binary)
- Enter the payload content
- Add multiple arguments if needed using the "+ Add Argument" button
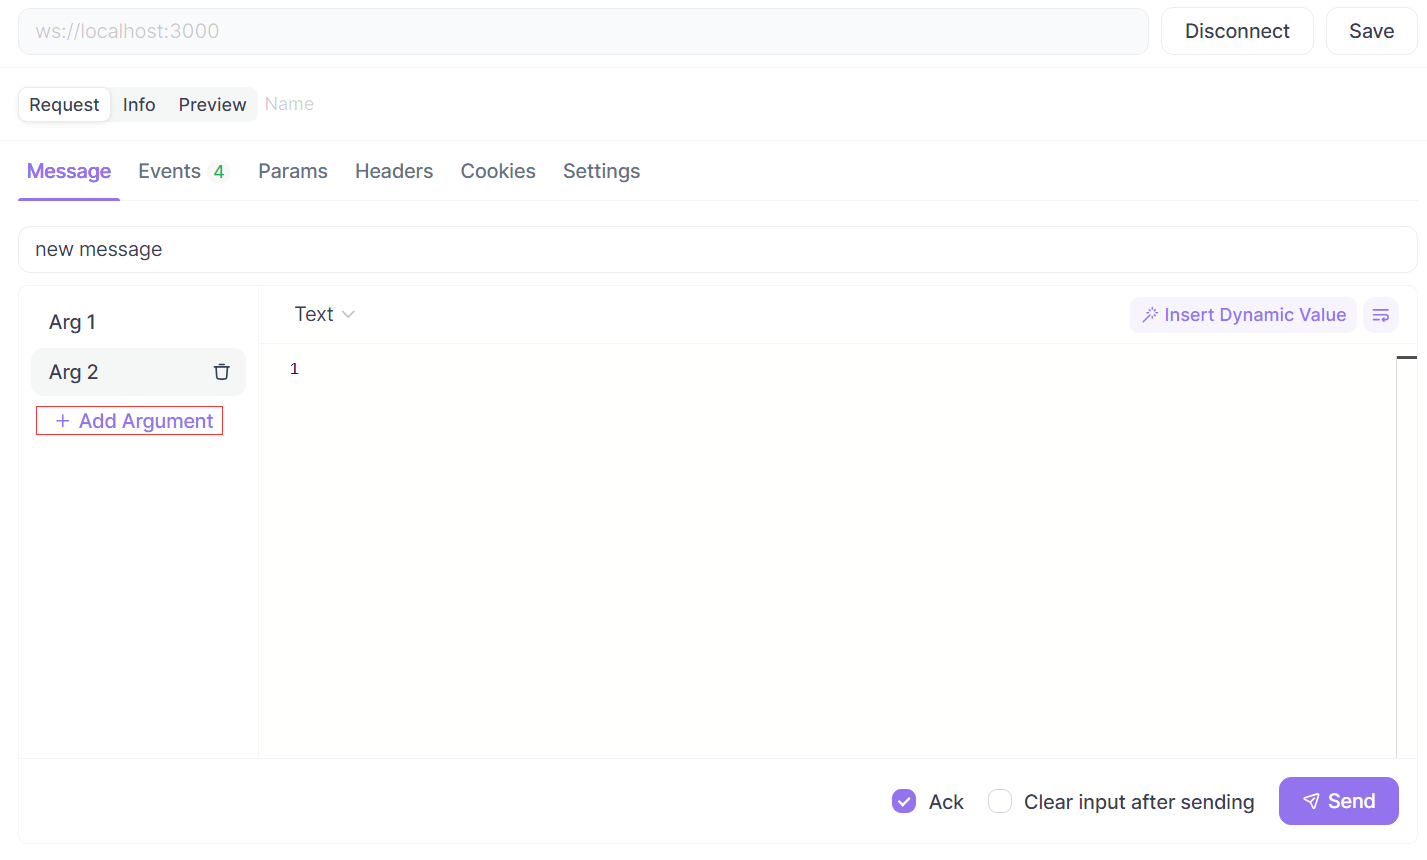
- Enable "Ack" if you expect a callback response
- Click "Send" to transmit the message
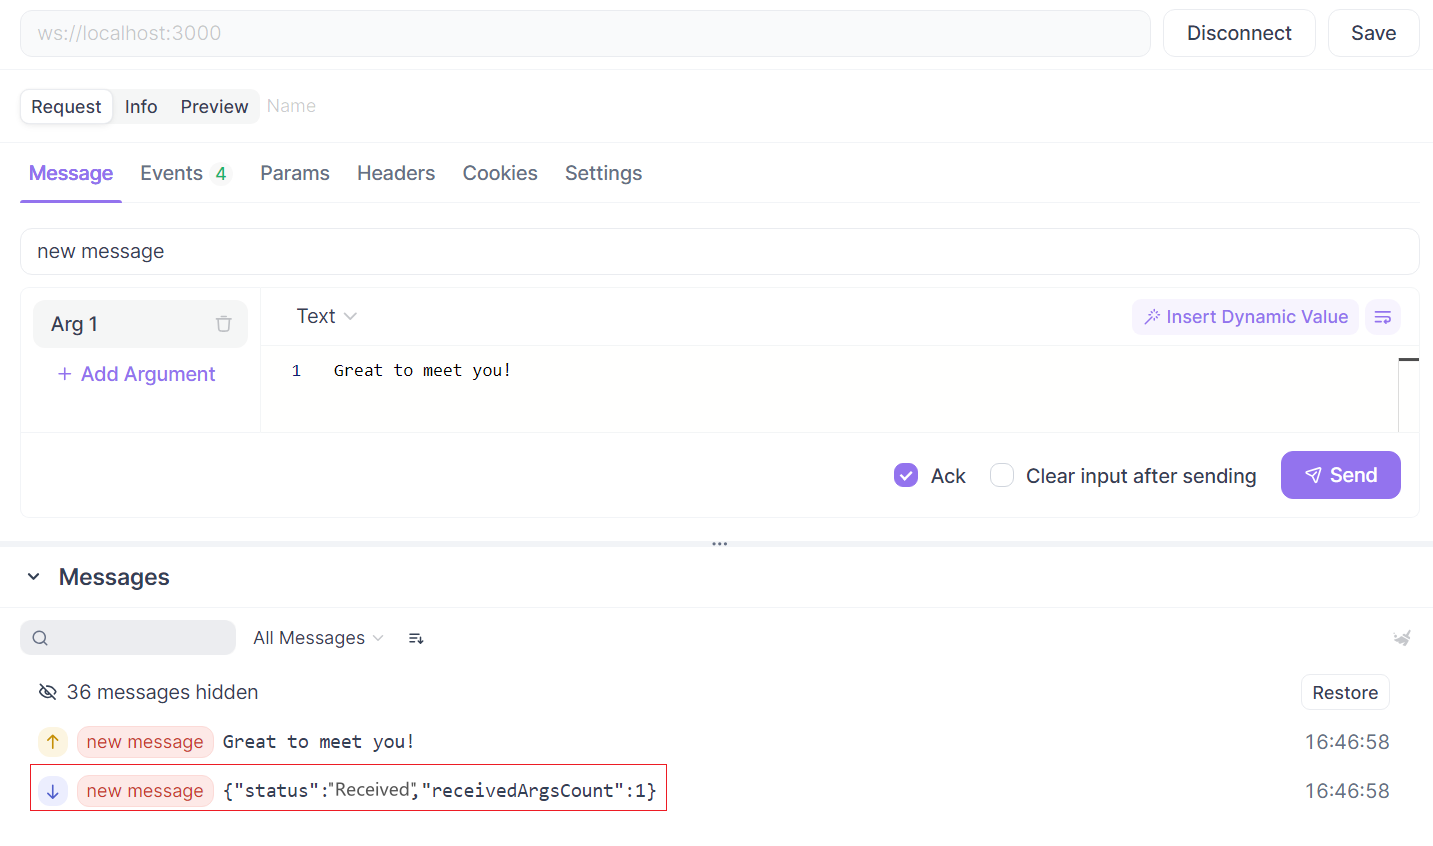
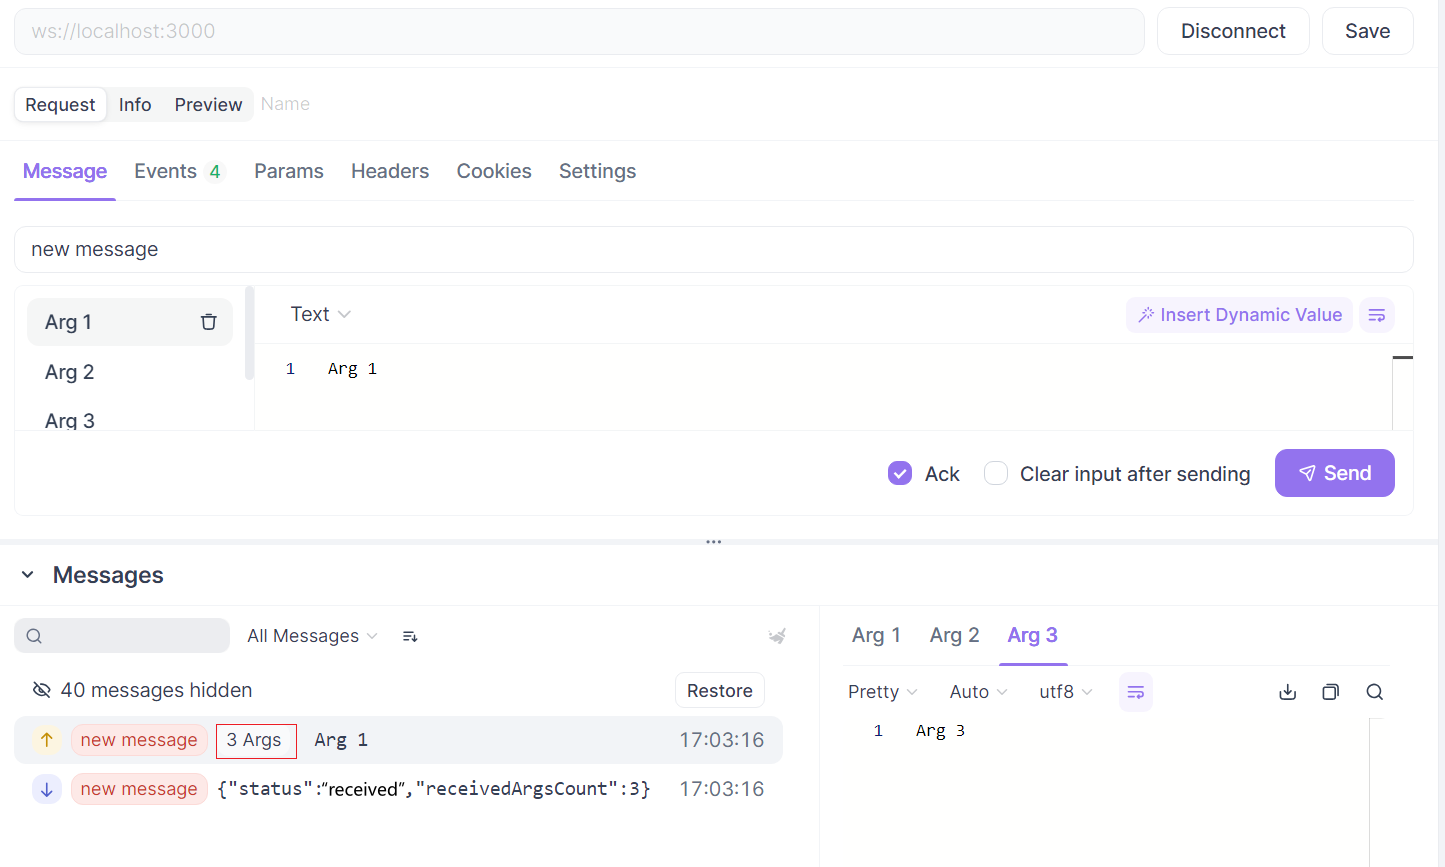
Analyze the communication timeline:
- Review the chronological list of all sent and received events
- Events are tagged with their names for easy identification
- Click on any event to view its detailed payload
- For messages with multiple arguments, expand the "x Args" label to see all values
4. Utilizing Advanced Features
Use variables for dynamic testing:
- Insert environment variables in your arguments using the
{{variable}}syntax - These variables are automatically replaced with their actual values when sending
- This enables testing different scenarios without manually changing payloads
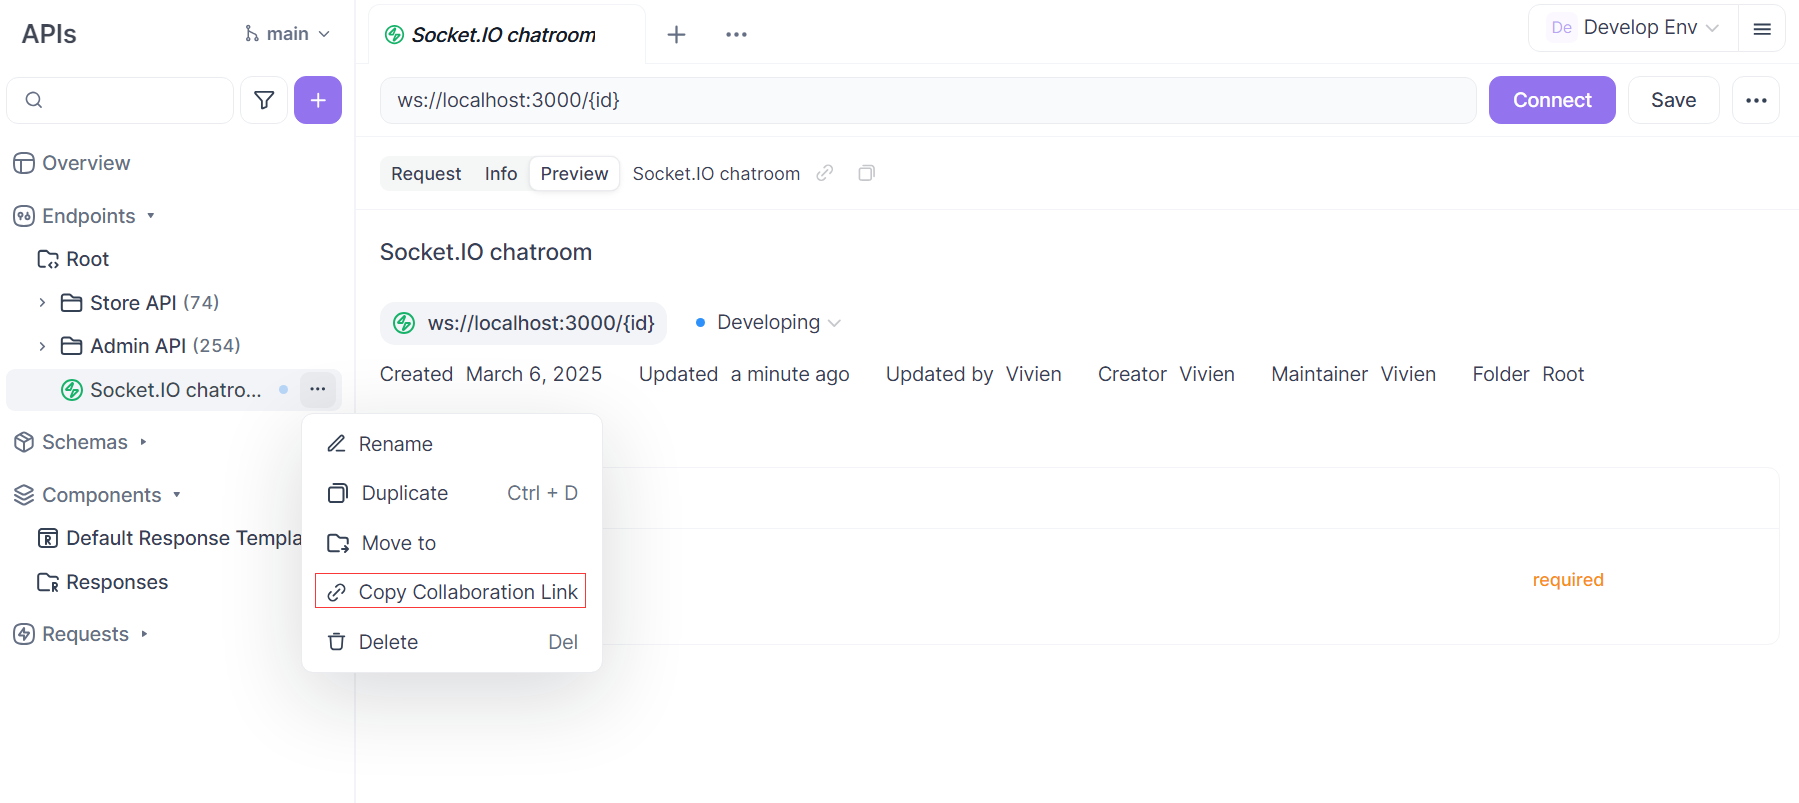
Save and document Socket.IO endpoints:
- Click the "Save" button to store the Socket.IO endpoint configuration
- Add descriptive names and documentation for team collaboration
- Organize endpoints in project folders for better management
Share configurations with team members:
- Generate documentation including Socket.IO endpoints
- Share the exact configuration for consistent testing across the team
Comparing Apidog's Approach with Code-Based Debugging
When comparing Apidog's Socket.IO debugging tool with code-based approaches, several key differences become apparent:
Visibility and Context
Code-based approach:
// Server-side logging
io.on('connection', (socket) => {
  console.log('New client connected', socket.id);

  socket.onAny((event, ...args) => {
    console.log(`[${socket.id}] Received event: ${event}`, args);
  });
});

// Client-side logging
socket.onAny((event, ...args) => {
  console.log(`Received event: ${event}`, args);
});
This approach requires:
- Separate console windows for client and server logs
- Manual correlation between related events
- Mental reconstruction of the event sequence
Apidog approach:
- Single unified timeline showing both sent and received events
- Clear visual distinction between event types
- Automatic decoding of Socket.IO protocol messages
- Contextual information about connection state and transport
Interaction Capabilities
Code-based approach:
// Custom test client for triggering events
const testEvent = (eventName, payload) => {
  console.log(`Sending test event: ${eventName}`, payload);
  socket.emit(eventName, payload, (response) => {
    console.log(`Received acknowledgement for ${eventName}:`, response);
  });
};

// Call from console
// testEvent('update-profile', { name: 'Alex' });
This approach requires:
- Writing custom test functions for each scenario
- Modifying code to add test capabilities
- Restarting the application to update test functions
Apidog approach:
- Interactive UI for sending events with any payload
- Support for multiple arguments and acknowledgements
- No code changes required to test different scenarios
- Ability to save and reuse test configurations
Troubleshooting Efficiency
Code-based approach:
// Detailed connection debugging
socket.io.on('reconnect_attempt', (attempt) => {
  console.log(`Reconnection attempt ${attempt}`);
  console.log('Transport options:', socket.io.opts.transports);
  console.log('Connection timeout:', socket.io.opts.timeout);
});

socket.on('connect_error', (error) => {
  console.error('Connection error:', error);
  console.log('Connection state:', socket.io.engine.readyState);
  console.log('Transport:', socket.io.engine.transport?.name);
});
This approach requires:
- Adding extensive logging code
- Restarting the application to update debugging logic
- Sifting through verbose logs to find relevant information
Apidog approach:
- Real-time visibility into connection state
- Detailed view of handshake parameters and transport selection
- Ability to modify connection parameters without code changes
- Clear error messages with contextual information
The Benefits of Using Apidog for Socket.IO Debugging
Apidog's Socket.IO debugging tool offers several significant advantages over code-based approaches:
- Reduced setup time: No need to write and maintain custom debugging code
- Comprehensive visibility: See both sides of the communication in a single interface
- Interactive testing: Trigger events and observe responses without code changes
- Protocol insights: Understand the underlying Socket.IO and Engine.io protocols
- Team collaboration: Share configurations and findings with team members
- Documentation integration: Automatically document Socket.IO endpoints alongside other APIs
For development teams, these benefits translate into tangible outcomes:
- Faster debugging cycles: Problems that previously required hours of investigation can often be identified in minutes
- Improved collaboration: Shared Socket.IO endpoint configurations ensure consistent testing across team members
- Higher quality: More thorough testing of real-time features leads to more reliable applications
- Better documentation: Automatically generated Socket.IO endpoint documentation improves knowledge sharing
Conclusion
Socket.IO has transformed how developers build real-time web applications, but its event-driven, bidirectional nature introduces unique debugging challenges. While code-based debugging approaches provide valuable insights, they often require significant setup effort and result in fragmented information across different tools and logs.
Apidog's Socket.IO debugging tool represents a significant advancement in how developers approach real-time application debugging. By providing a unified interface for connection management, event monitoring, and interactive testing, it addresses the core challenges that have historically made Socket.IO debugging difficult.
For development teams working with Socket.IO, adopting specialized debugging tools like Apidog's can dramatically improve productivity and code quality. The ability to observe, interact with, and troubleshoot Socket.IO connections in real-time—without writing custom debugging code—allows developers to focus on building features rather than fighting with tools.
As real-time features become increasingly central to modern web applications, the importance of effective debugging tools will only grow. By combining code-based debugging techniques with purpose-built tools like Apidog's Socket.IO debugger, developers can ensure their real-time applications deliver the reliability and performance users expect.
Whether you're building a chat application, collaborative editor, live dashboard, or any other real-time feature, the right debugging approach can make the difference between a frustrating development experience and a productive one. With Apidog's Socket.IO debugging tool, that experience just got significantly better.