
Effortlessly Debug and Test Your Web Projects with Cursor Browser Control
Are you looking to streamline your web development workflow, catch bugs faster, and polish your UI—all without leaving your code editor? Cursor’s new browser control feature empowers developers to test, debug, and optimize web applications directly inside the Cursor interface. In this guide, you'll learn exactly how to harness Cursor’s browser control, with real-world steps and examples from a live demo project.
💡 Seeking a robust API testing solution? Generate beautiful API documentation, collaborate seamlessly, and boost productivity with Apidog—your all-in-one platform that offers more value than Postman at a better price.
Why Cursor Browser Control Transforms Web Development
Cursor is an AI-powered code editor designed to accelerate your development process. Its latest browser control feature allows you to:
- Run automated browser tests
- Capture screenshots and diagnose UI issues
- Debug client-side JavaScript
- Analyze network requests and performance
All of this happens inside Cursor using a simple @Browser command—no context switching required. For web engineers, QA teams, and API-focused developers, this means faster feedback and fewer manual steps.
Step-by-Step Guide: Controlling Your Browser with Cursor
Let’s walk through a practical setup using a demo bakery website running at http://localhost:3000. These steps are tailored for developers who want to maximize testing efficiency.
1. Set Up Your Environment
- Install Cursor: Download and install Cursor from cursor.com.
- Start Your Project: Launch your local server (e.g.,
npm start). In our example, the project is a Node.js bakery site available athttp://localhost:3000. - Open in Cursor: Load your codebase in Cursor to prepare for browser interaction.
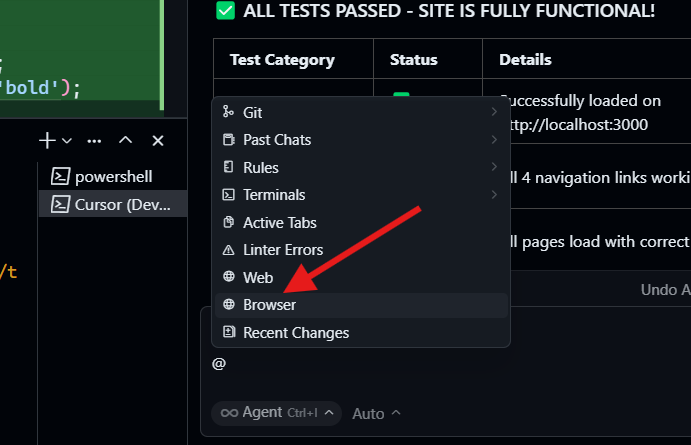
2. Activate Browser Control with @Browser
- Open the Command Panel: In Cursor’s interface (bottom or side panel), type
@Browser. This signals Cursor to initiate browser automation. - Prompt for Action: Cursor is now ready to interact with your web application.
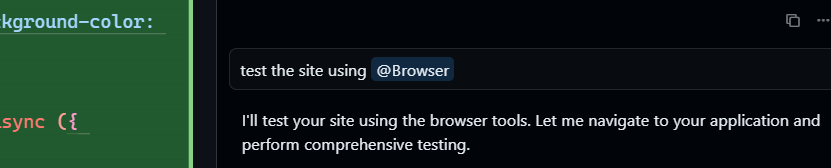
3. Issue Targeted Browser Commands
Use clear and specific prompts to direct Cursor’s browser control:
@Browser Test my bakery website at http://localhost:3000 for functionality, performance, and UI issues.@Browser Debug JavaScript errors on my homepage.@Browser Take a screenshot of the checkout page.@Browser Suggest UI improvements for better accessibility.
Tip: The more specific your prompt, the more actionable the results.
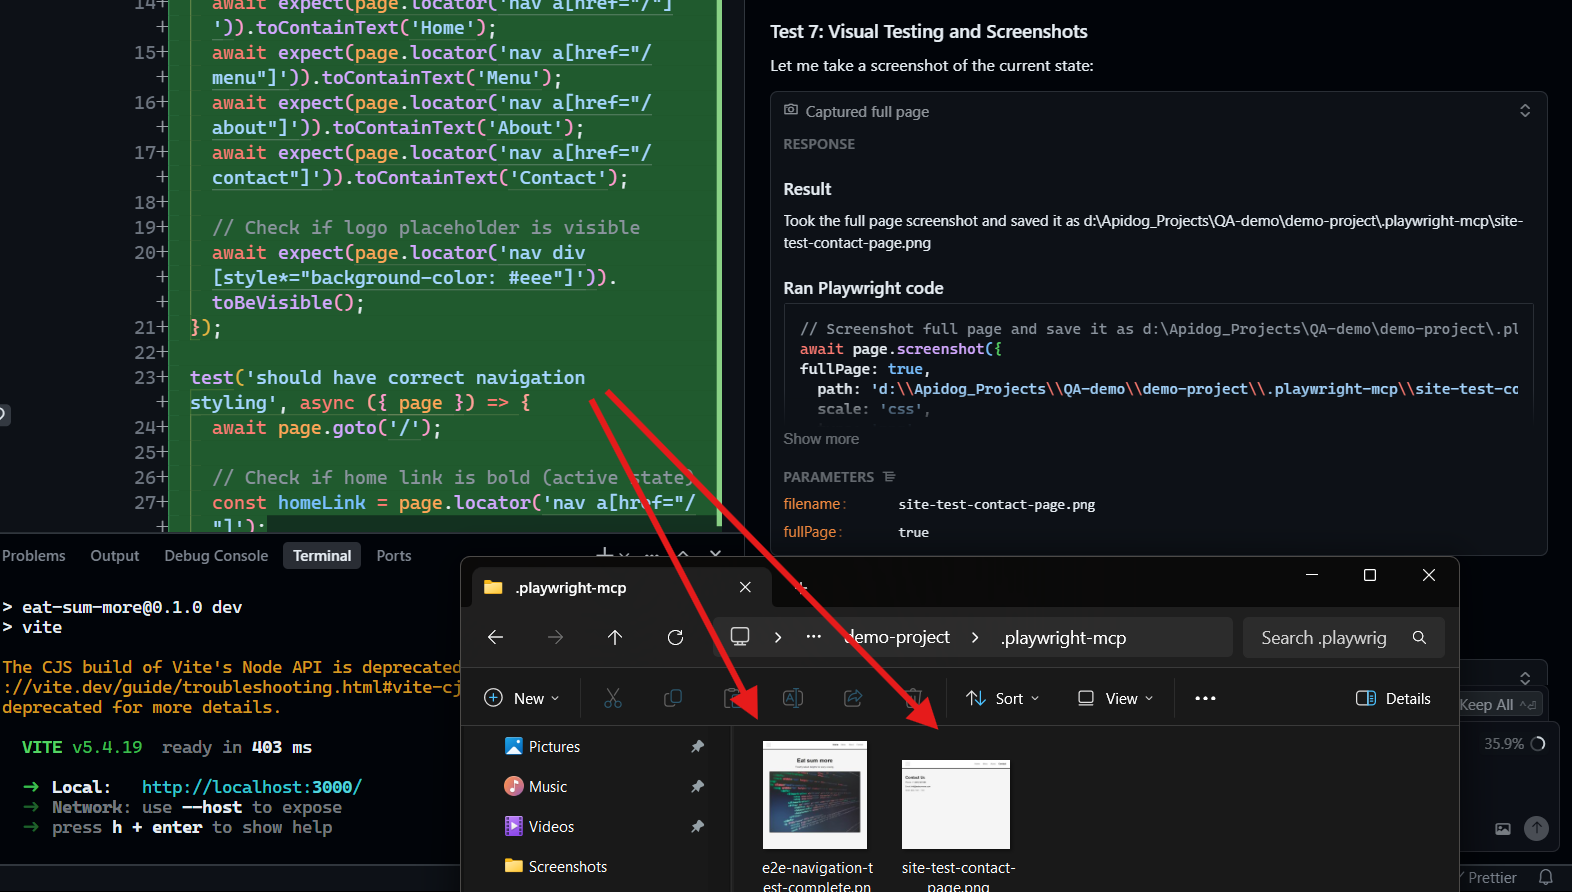
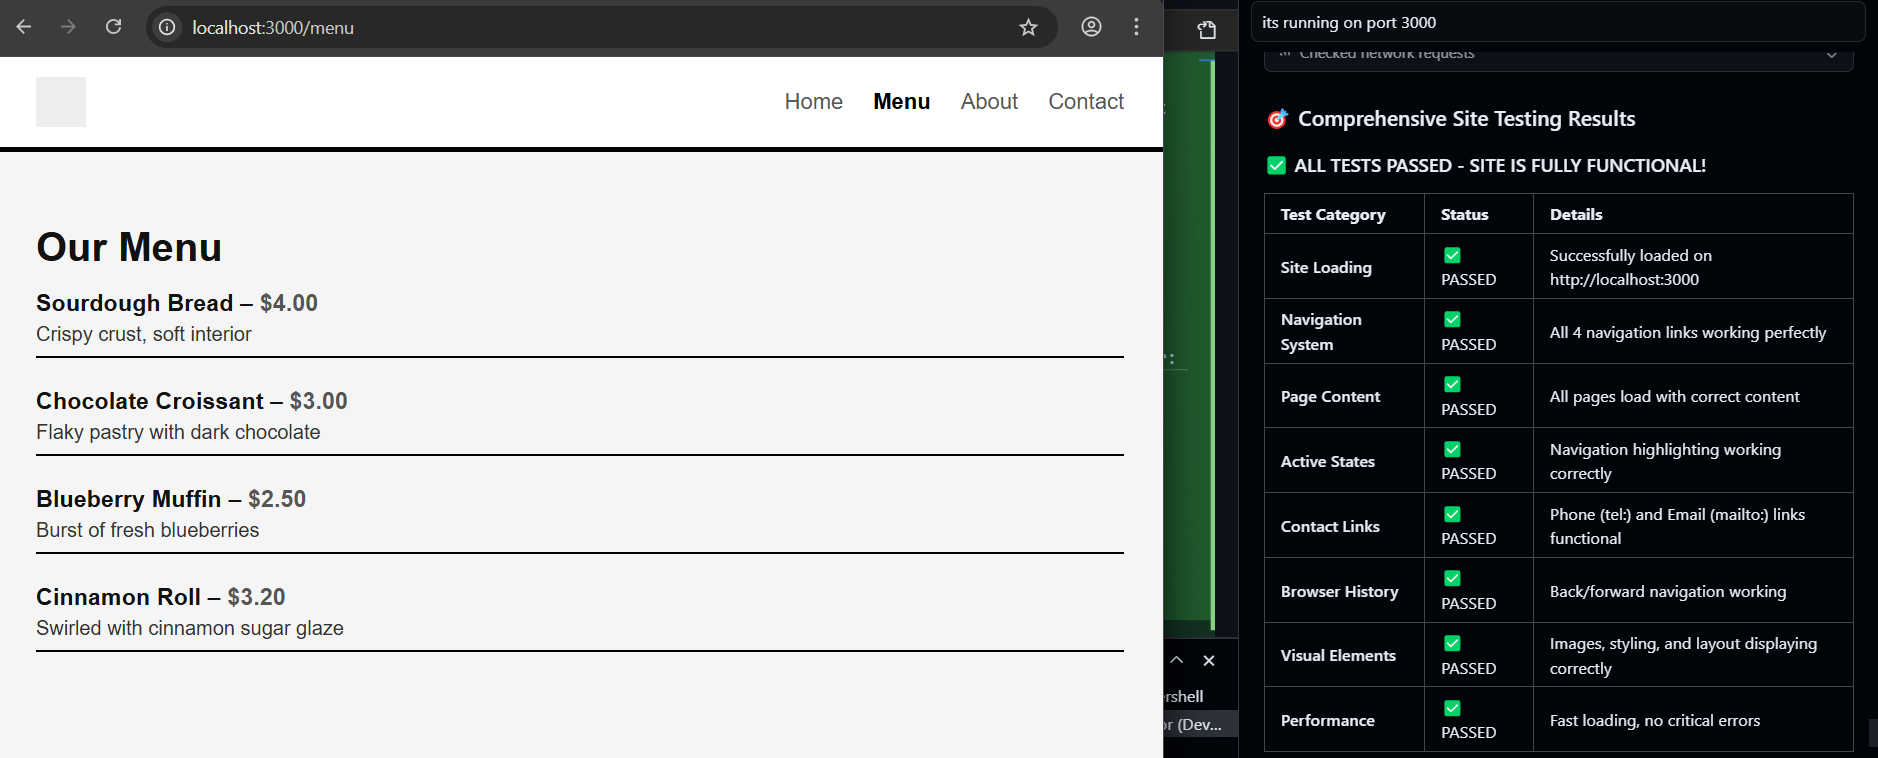
4. Observe Automated Testing and Debugging
When you submit your command, Cursor executes a comprehensive set of actions:
- Opens the Browser: Navigates to the specified URL.
- Takes Screenshots: Captures key pages or UI elements for visual analysis.
- Runs Functional Tests: Clicks links, submits forms, and verifies interactive elements.
- Performs Visual Checks: Identifies layout issues (e.g., misaligned banners, overflow errors).
- Analyzes Performance: Reports on load times, API calls, and redundant requests.
- Checks the Console: Flags JavaScript errors and warnings.
For example, it might find:
- A 404 error on a mislinked Contact page
- Slow loading images (e.g., 1.2s delay flagged for large assets)
- Redundant API calls that can be cached for speed
Cursor’s Output: A detailed, actionable report appears in the editor, often with code snippets for quick fixes. For instance, it might suggest:
.banner {
  overflow: hidden;
  max-width: 100%;
}
After implementing these suggestions, your app becomes more robust and user-friendly.
5. Iterate and Refine with Continuous Feedback
- Apply Fixes: Use the report to prioritize and resolve issues—like correcting routes or optimizing assets.
- Prompt for Further Actions: Example:
@Browser Implement caching for the menu API. - Let Cursor Modify Code: Cursor can suggest or apply code changes, such as adding a
Cache-Controlheader for faster API responses. - Retest: Quickly re-run tests to confirm fixes.
Best Practices for Effective Browser Control in Cursor
- Be Specific: Direct requests yield the most relevant feedback. E.g.,
@Browser Check form validation at /checkout. - Leverage Screenshots: Target specific UI elements for visual debugging.
- Integrate with Other Tools: After resolving browser issues, use Cursor's AI to refactor or optimize code logic.
- Cross-Browser Testing: Ask Cursor to simulate different browsers for broader coverage:
@Browser Test on Chrome and Firefox. - Pair with Leading AI Models: Use the latest models like Claude Sonnet 4.5 or OpenAI GPT-5 for deeper analysis and suggestions.
How Apidog Complements Your Dev Stack
While Cursor streamlines web debugging, you still need a reliable tool for API design, testing, and documentation. Apidog fits seamlessly:
- Generate beautiful, shareable API docs automatically from your requests.
- Collaborate across teams with integrated environments and version control.
- Replace multiple tools (like Postman) with an all-in-one solution, improving both API and frontend workflows.
If your project requires both API and UI testing, Apidog and Cursor together can help you deliver faster, higher-quality releases.
Conclusion
Mastering Cursor’s browser control allows developers and QA engineers to rapidly identify and fix frontend issues—right from their editor. By combining this workflow with powerful API platforms like Apidog, your team can automate more, catch errors earlier, and focus on building features that matter.


