Debugging modern web applications can be a maze, especially when tracking down elusive bugs across different tools and consoles. But what if you could automate browser inspections, performance audits, and error tracing—using AI, right from your terminal? That’s now possible by integrating Claude Code with the Chrome DevTools MCP Server.
This hands-on guide shows API developers and technical teams how to set up this powerful combination, streamline your debugging workflow, and unlock advanced browser automation—saving you time and reducing context switching. Whether you’re building a complex React app or managing legacy APIs, mastering this integration will help you catch issues early and deliver better user experiences.
💡 Looking for an API testing tool that generates beautiful API Documentation and offers an all-in-one platform for your team to work seamlessly? Apidog provides robust collaboration tools and replaces Postman at a much more affordable price. Boost your team's productivity with Apidog today.
What Is the Chrome DevTools MCP Server?
The Chrome DevTools MCP Server is an open-source extension of Chrome’s DevTools protocol, designed for the Model Context Protocol (MCP). MCP allows AI agents—like Claude Code—to control browser instances, query DOM elements, capture network activity, and run audits programmatically.
Key Features:
- Real-time console logging and JavaScript evaluation
- Automated performance and accessibility audits
- Remote debugging across devices
- API access to browser internals
Before MCP, AI coding tools like Claude Code lacked direct insight into runtime browser behavior. Now, with the DevTools MCP Server, your AI assistant can observe, analyze, and act on live web pages—closing the gap between code and runtime reality.
Why Integrate Claude Code with Chrome DevTools MCP Server?
Pairing Claude Code with the Chrome DevTools MCP Server brings AI-driven automation directly to your browser debugging workflow:
- Automated Issue Detection: Let Claude inspect DOM, trace performance, or run accessibility checks with natural language prompts.
- Faster Debugging: Reduce context switching—trigger audits, capture logs, or simulate user flows without leaving your CLI.
- Seamless Integration: No heavy IDE plugins required; works with any tech stack or framework.
- Team Efficiency: Share reproducible debugging sessions and reports across your team.
Benchmarks: Community tests show that using the DevTools MCP Server with Claude Code can reduce debugging time by up to 40%, helping you ship cleaner code faster.
Step-by-Step: Setting Up Claude Code with Chrome DevTools MCP Server
Ready to streamline your browser debugging? Here’s how to connect Claude Code to the Chrome DevTools MCP Server for advanced automation.
Step 1: Open Your Project and Start Claude Code
Open a terminal in your project’s root directory (e.g., your React, Vue, or Node.js app). This ensures Claude Code can access your project files for contextual debugging.
Start a session with:
claude
Claude Code will scan your codebase and initialize its agent environment.
Step 2: Install the Chrome DevTools MCP Server
Within your Claude session, add the DevTools server using MCP management:
claude mcp add chrome-devtools npx chrome-devtools-mcp@latest
- This uses
npxto fetch and install the latest server version without polluting your global npm. - Setup typically completes in under a minute.
- You’ll see a confirmation:
"MCP Server 'chrome-devtools' added successfully."
Step 3: Verify the Integration
Restart or ensure Claude Code is running:
claude
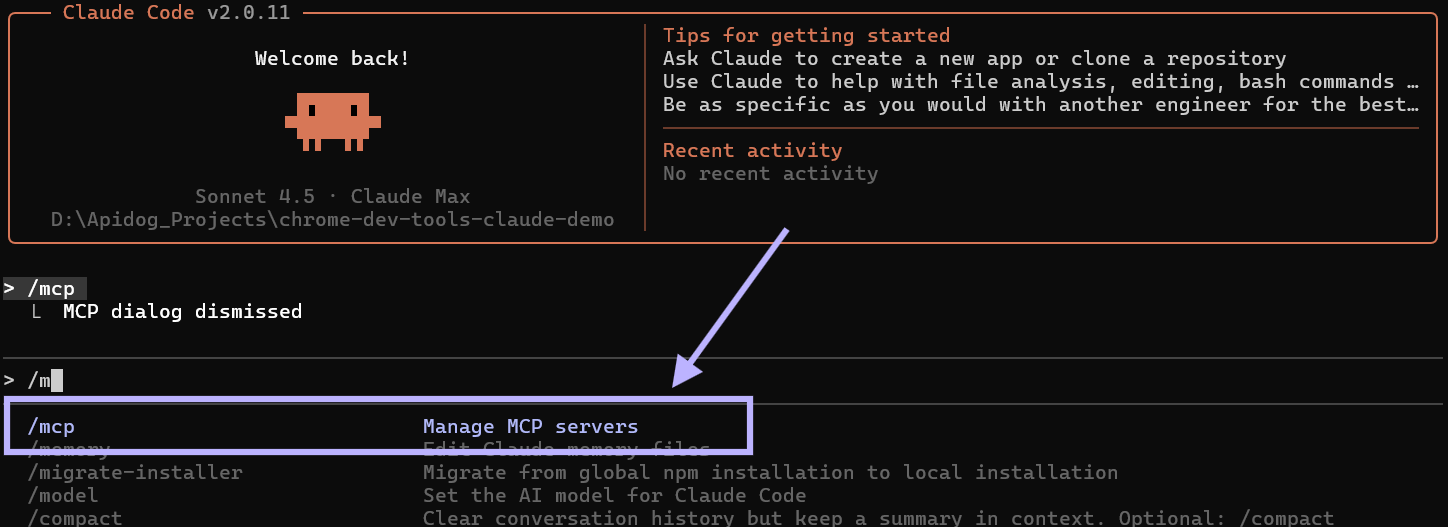
To check that the DevTools MCP Server is connected, enter:
/mcp
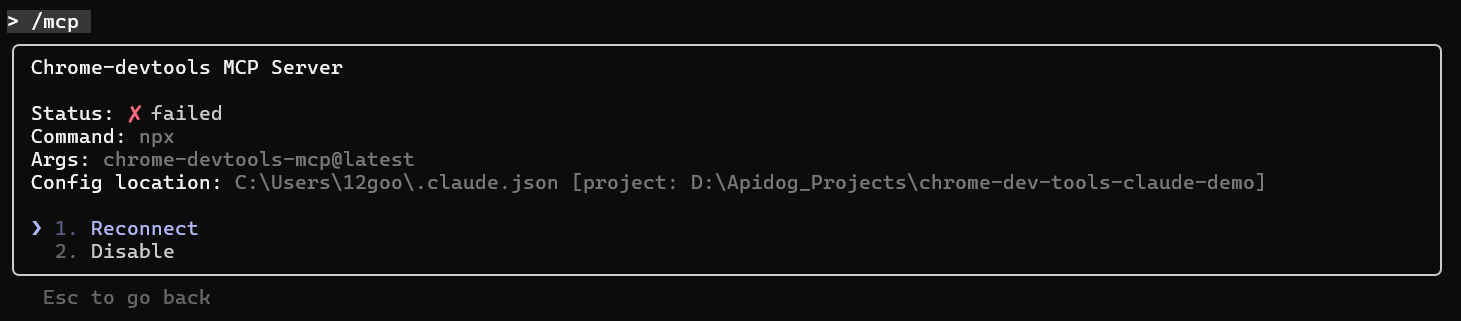
You should see "chrome-devtools" in the list of available servers, with a “Connected” status.
If disconnected, hit “Enter” at the prompt and select “Reconnect.” Claude will automatically handle most issues, including port conflicts.
Step 4: Run Your First Automated Browser Debug
Test the integration by prompting Claude to analyze a live site. For example:
Check the performance of https://developers.chrome.com using the Chrome DevTools MCP Server.
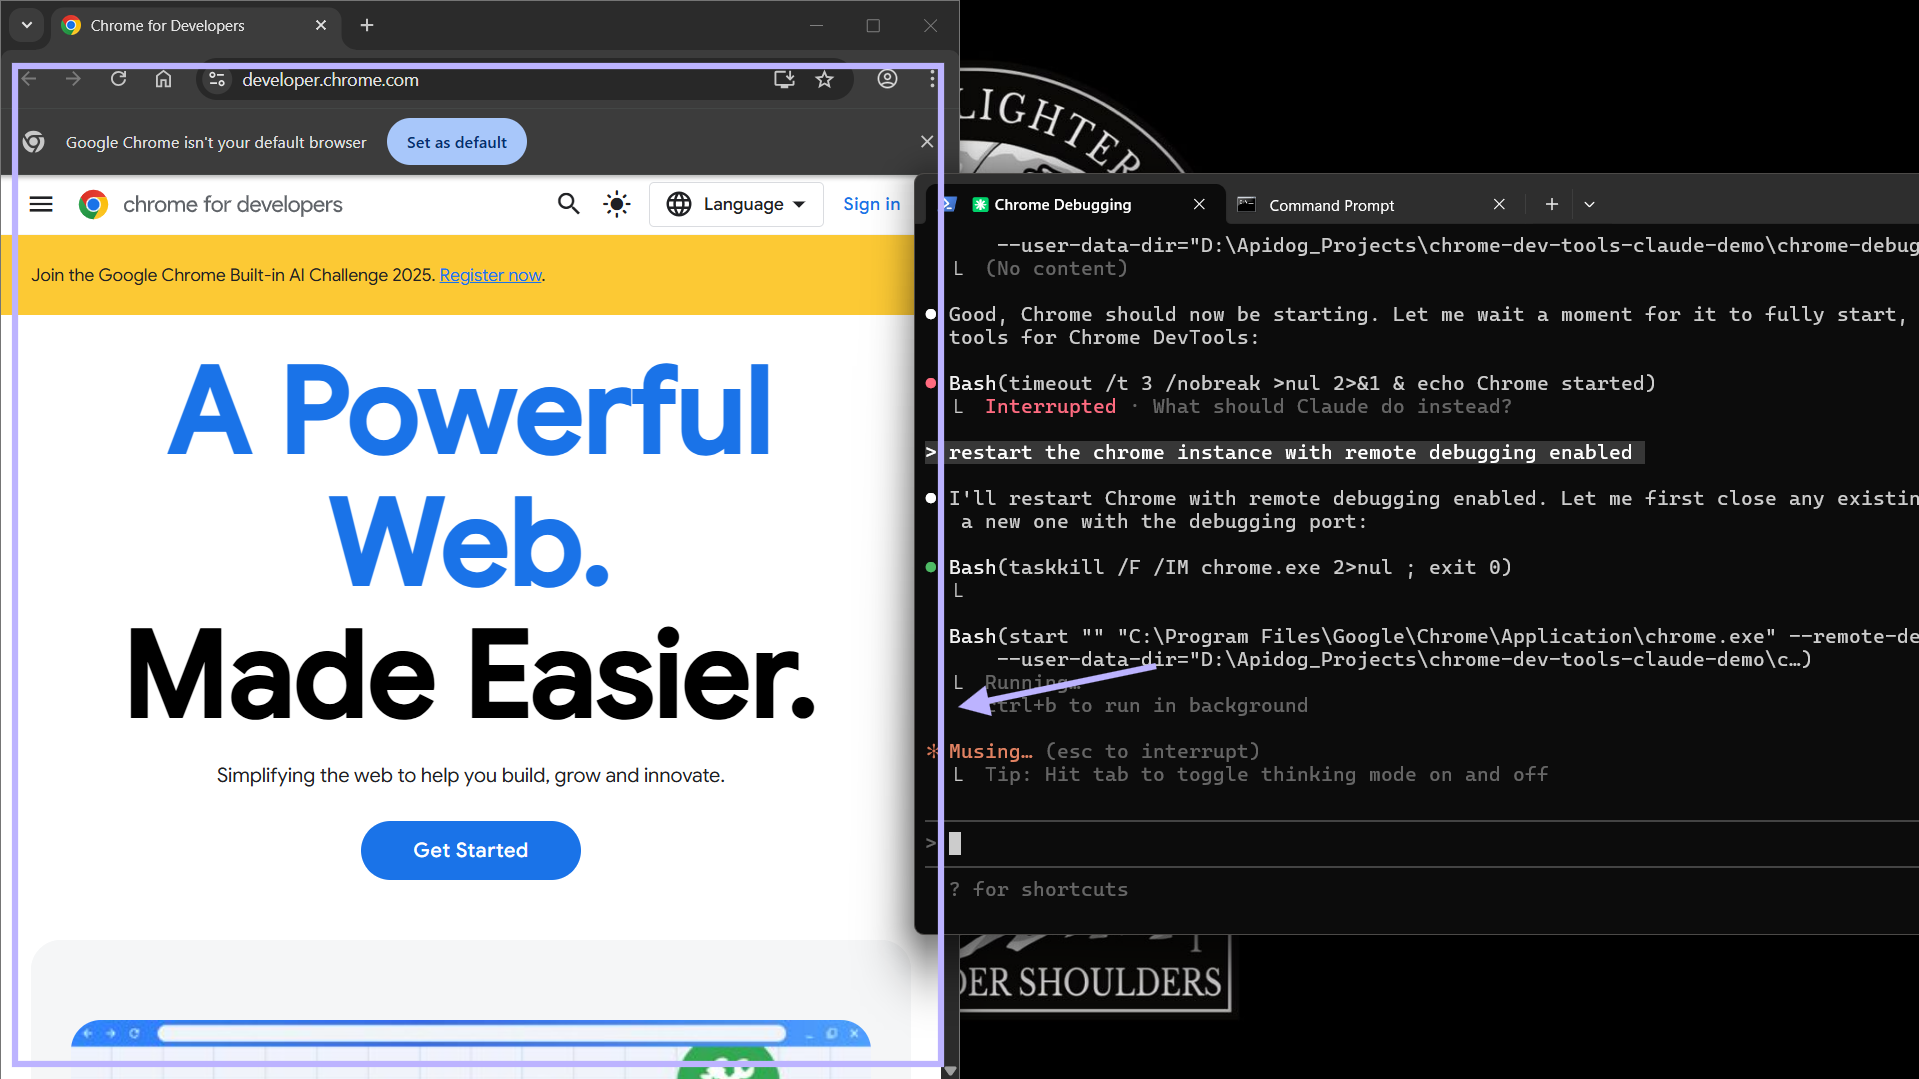
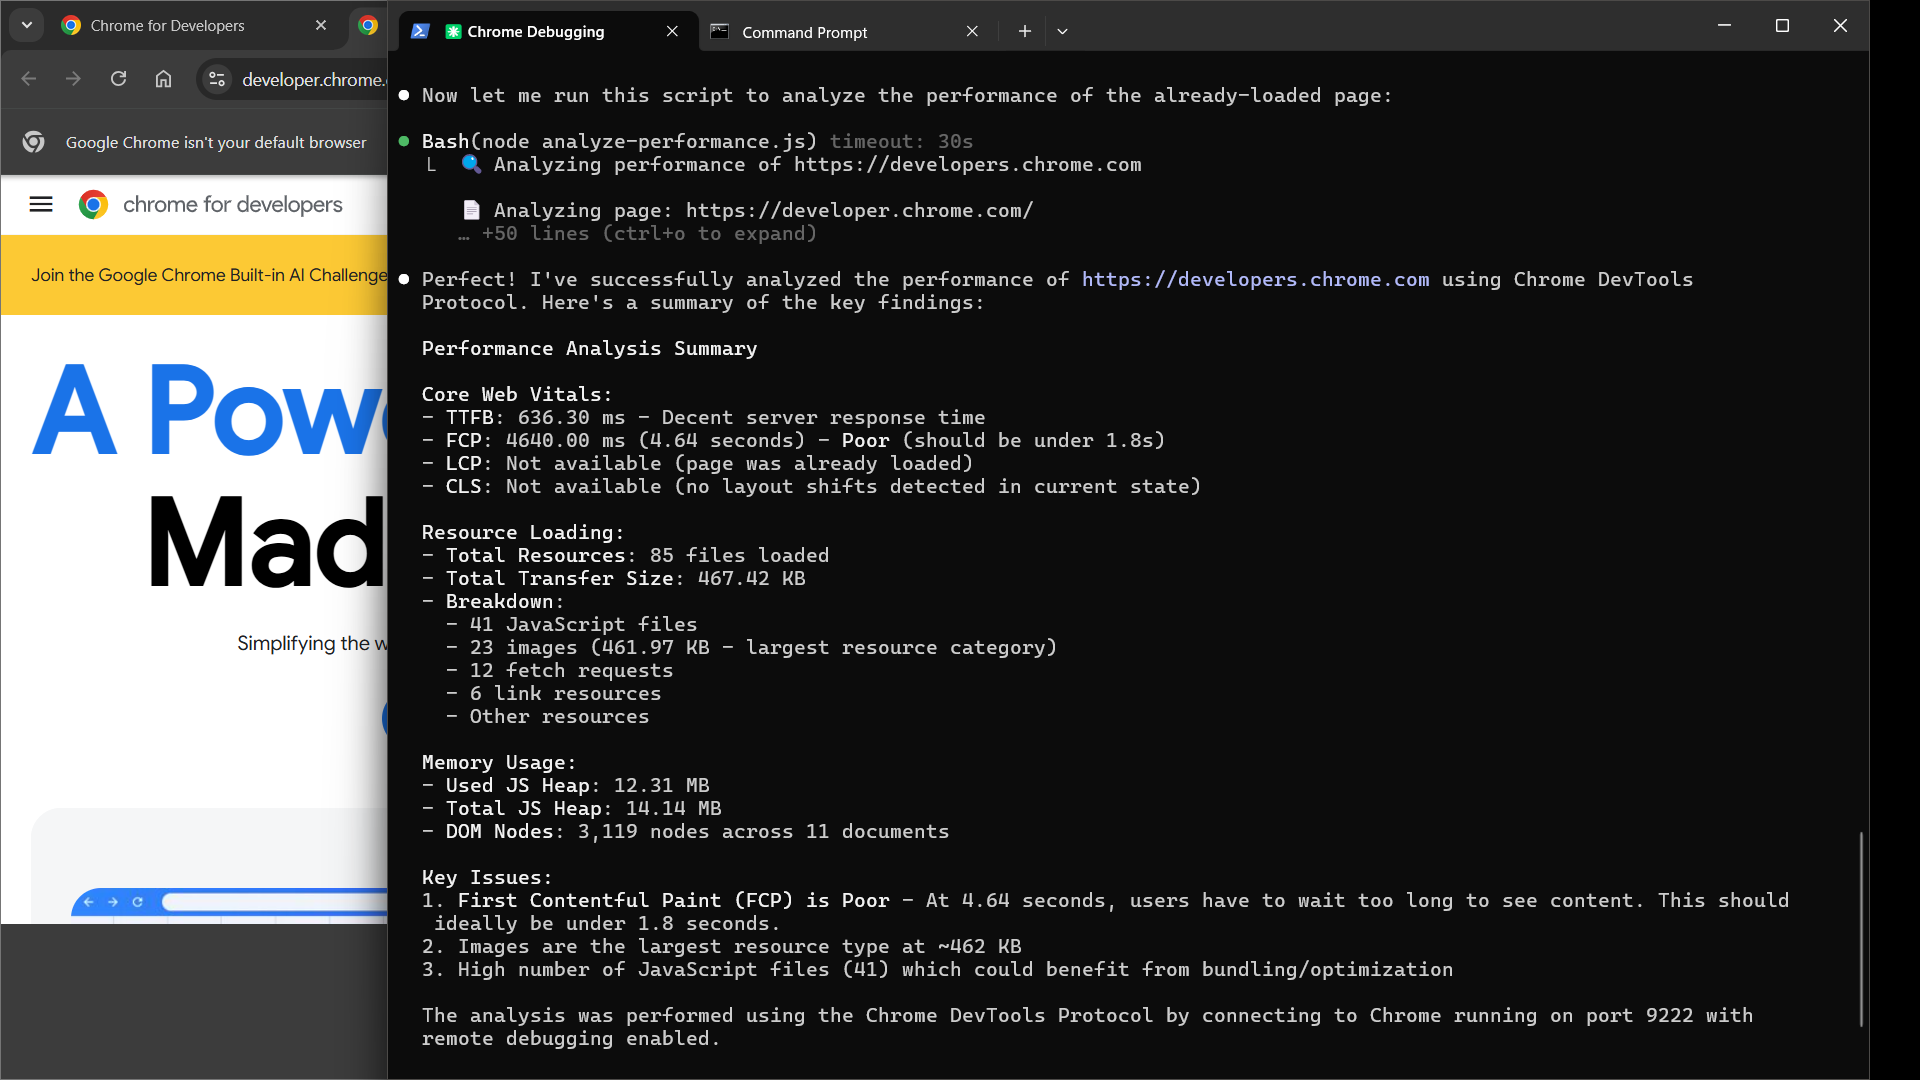
Claude will:
- Launch a new Chrome instance in remote debugging mode (default: port 9222)
- Navigate to the target URL
- Initiate a performance trace (capturing load times, CPU, resource usage)
- Analyze and report on key metrics
You’ll receive a detailed, actionable report—such as suggestions to defer non-critical JS or optimize images to improve LCP.
Troubleshooting Common Setup Issues
Even robust setups can hit snags. Here’s how to resolve typical problems:
-
Remote Debugging Fails to Launch:
Start Chrome manually in remote debugging mode.PowerShell:
& "C:\Program Files\Google\Chrome\Application\chrome.exe" --remote-debugging-port=9222 --user-data-dir="C:\some\folder"CMD:
start chrome --remote-debugging-port=9222 --user-data-dir="C:\some\folder"Use a temporary folder for the user-data-dir to avoid profile conflicts.
-
Configuration Errors:
Claude Code will typically auto-detect and prompt fixes (e.g., outdated npx). If issues persist:- Check firewall settings (port 9222)
- Update Chrome to the latest version
- Consult the chrome-devtools-mcp GitHub repo for diagnostics
With these steps, you’ll minimize downtime and keep your debugging workflow running smoothly.
Advanced Debugging Scenarios and Automation
The Chrome DevTools MCP Server unlocks more than just performance audits:
-
Console Error Analysis:
Prompt:
"Inspect console errors on my localhost:3000 app and suggest fixes."
Claude will log stack traces and propose actionable patches. -
Network & API Tracing:
Prompt:
"Trace API calls to https://api.example.com and identify slow endpoints."
Get latency breakdowns and waterfall diagrams. -
Accessibility Audits:
Prompt:
"Run an a11y scan on this checkout page."
Receive direct feedback on contrast ratios, ARIA labels, and more. -
CI/CD Integration:
Automate regression tests with Claude by scripting pre-merge browser checks via the DevTools MCP Server.
As multi-tab and cross-origin debugging expand, you’ll have even more ways to automate browser QA and optimize your user experience.
Conclusion: Debug Smarter and Deliver Better APIs
Integrating Claude Code with the Chrome DevTools MCP Server brings AI-powered browser automation to your CLI. From inspecting performance to automating audits, this workflow will help your team resolve issues faster and build more reliable web applications.
For API developers and teams seeking similar automation in API testing, documentation, and collaboration, Apidog offers an all-in-one platform that integrates seamlessly with your development process—empowering you to focus on delivering polished APIs.
Experiment with your own prompts, streamline complex debugging tasks, and watch your productivity soar.