In the era of software development, precision, and error-free codes are paramount. However, it is easy to find code errors and bugs that can affect your application's reliability. This is where debugging steps in to save you.
What is Debugging?
Before diving into the intricacies of Apidog, it's essential to understand the concept of debugging. Debugging is the systematic process of identifying, analyzing, and rectifying errors or "bugs" in software code. These bugs can range from minor glitches that cause unexpected behavior to critical issues that can crash an entire system.
Debugging is not just about fixing errors; it's about understanding the software's flow and ensuring it aligns with the intended logic and functionality. It's a detective's work, where developers play the role of investigators, delving deep into code lines, logs, and system responses to pinpoint the root cause of issues.
Why is Debugging Important?
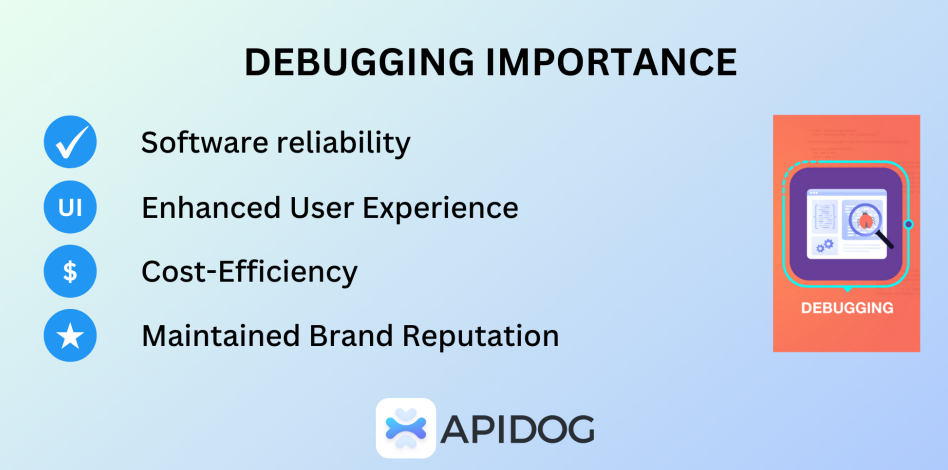
- Ensuring Software Reliability: Software riddled with bugs can lead to data loss, system crashes, and security vulnerabilities.
- Enhancing User Experience: Bugs can severely hamper user experience, leading to dissatisfaction and reduced user retention.
- Cost-Efficiency: Early detection of bugs during the development phase reduces costs associated with post-deployment fixes.
- Maintaining Brand Reputation: A software glitch can tarnish a brand's reputation in today's competitive market.

How to Debug APIs in Apidog Effectively?
Apidog stands out as a leading API platform. It offers a comprehensive suite of features that cater to both the creation and management of APIs. From designing to debugging, Apidog provides developers with a one-stop solution for all their API needs.

Apidog's Debug Mode Streamlines API Development in the following ways:
No Need for Early Documentation:
In traditional API development, one of the first steps is to draft comprehensive documentation detailing every aspect of the API. It can be time-consuming and might even slow down the actual development process. Apidog's Debug Mode changes this approach. Instead of starting with extensive documentation, developers can immediately begin with the core development and debugging. It ensures they can focus on building and refining the API without getting bogged down by preliminary documentation.
Automation Testing:
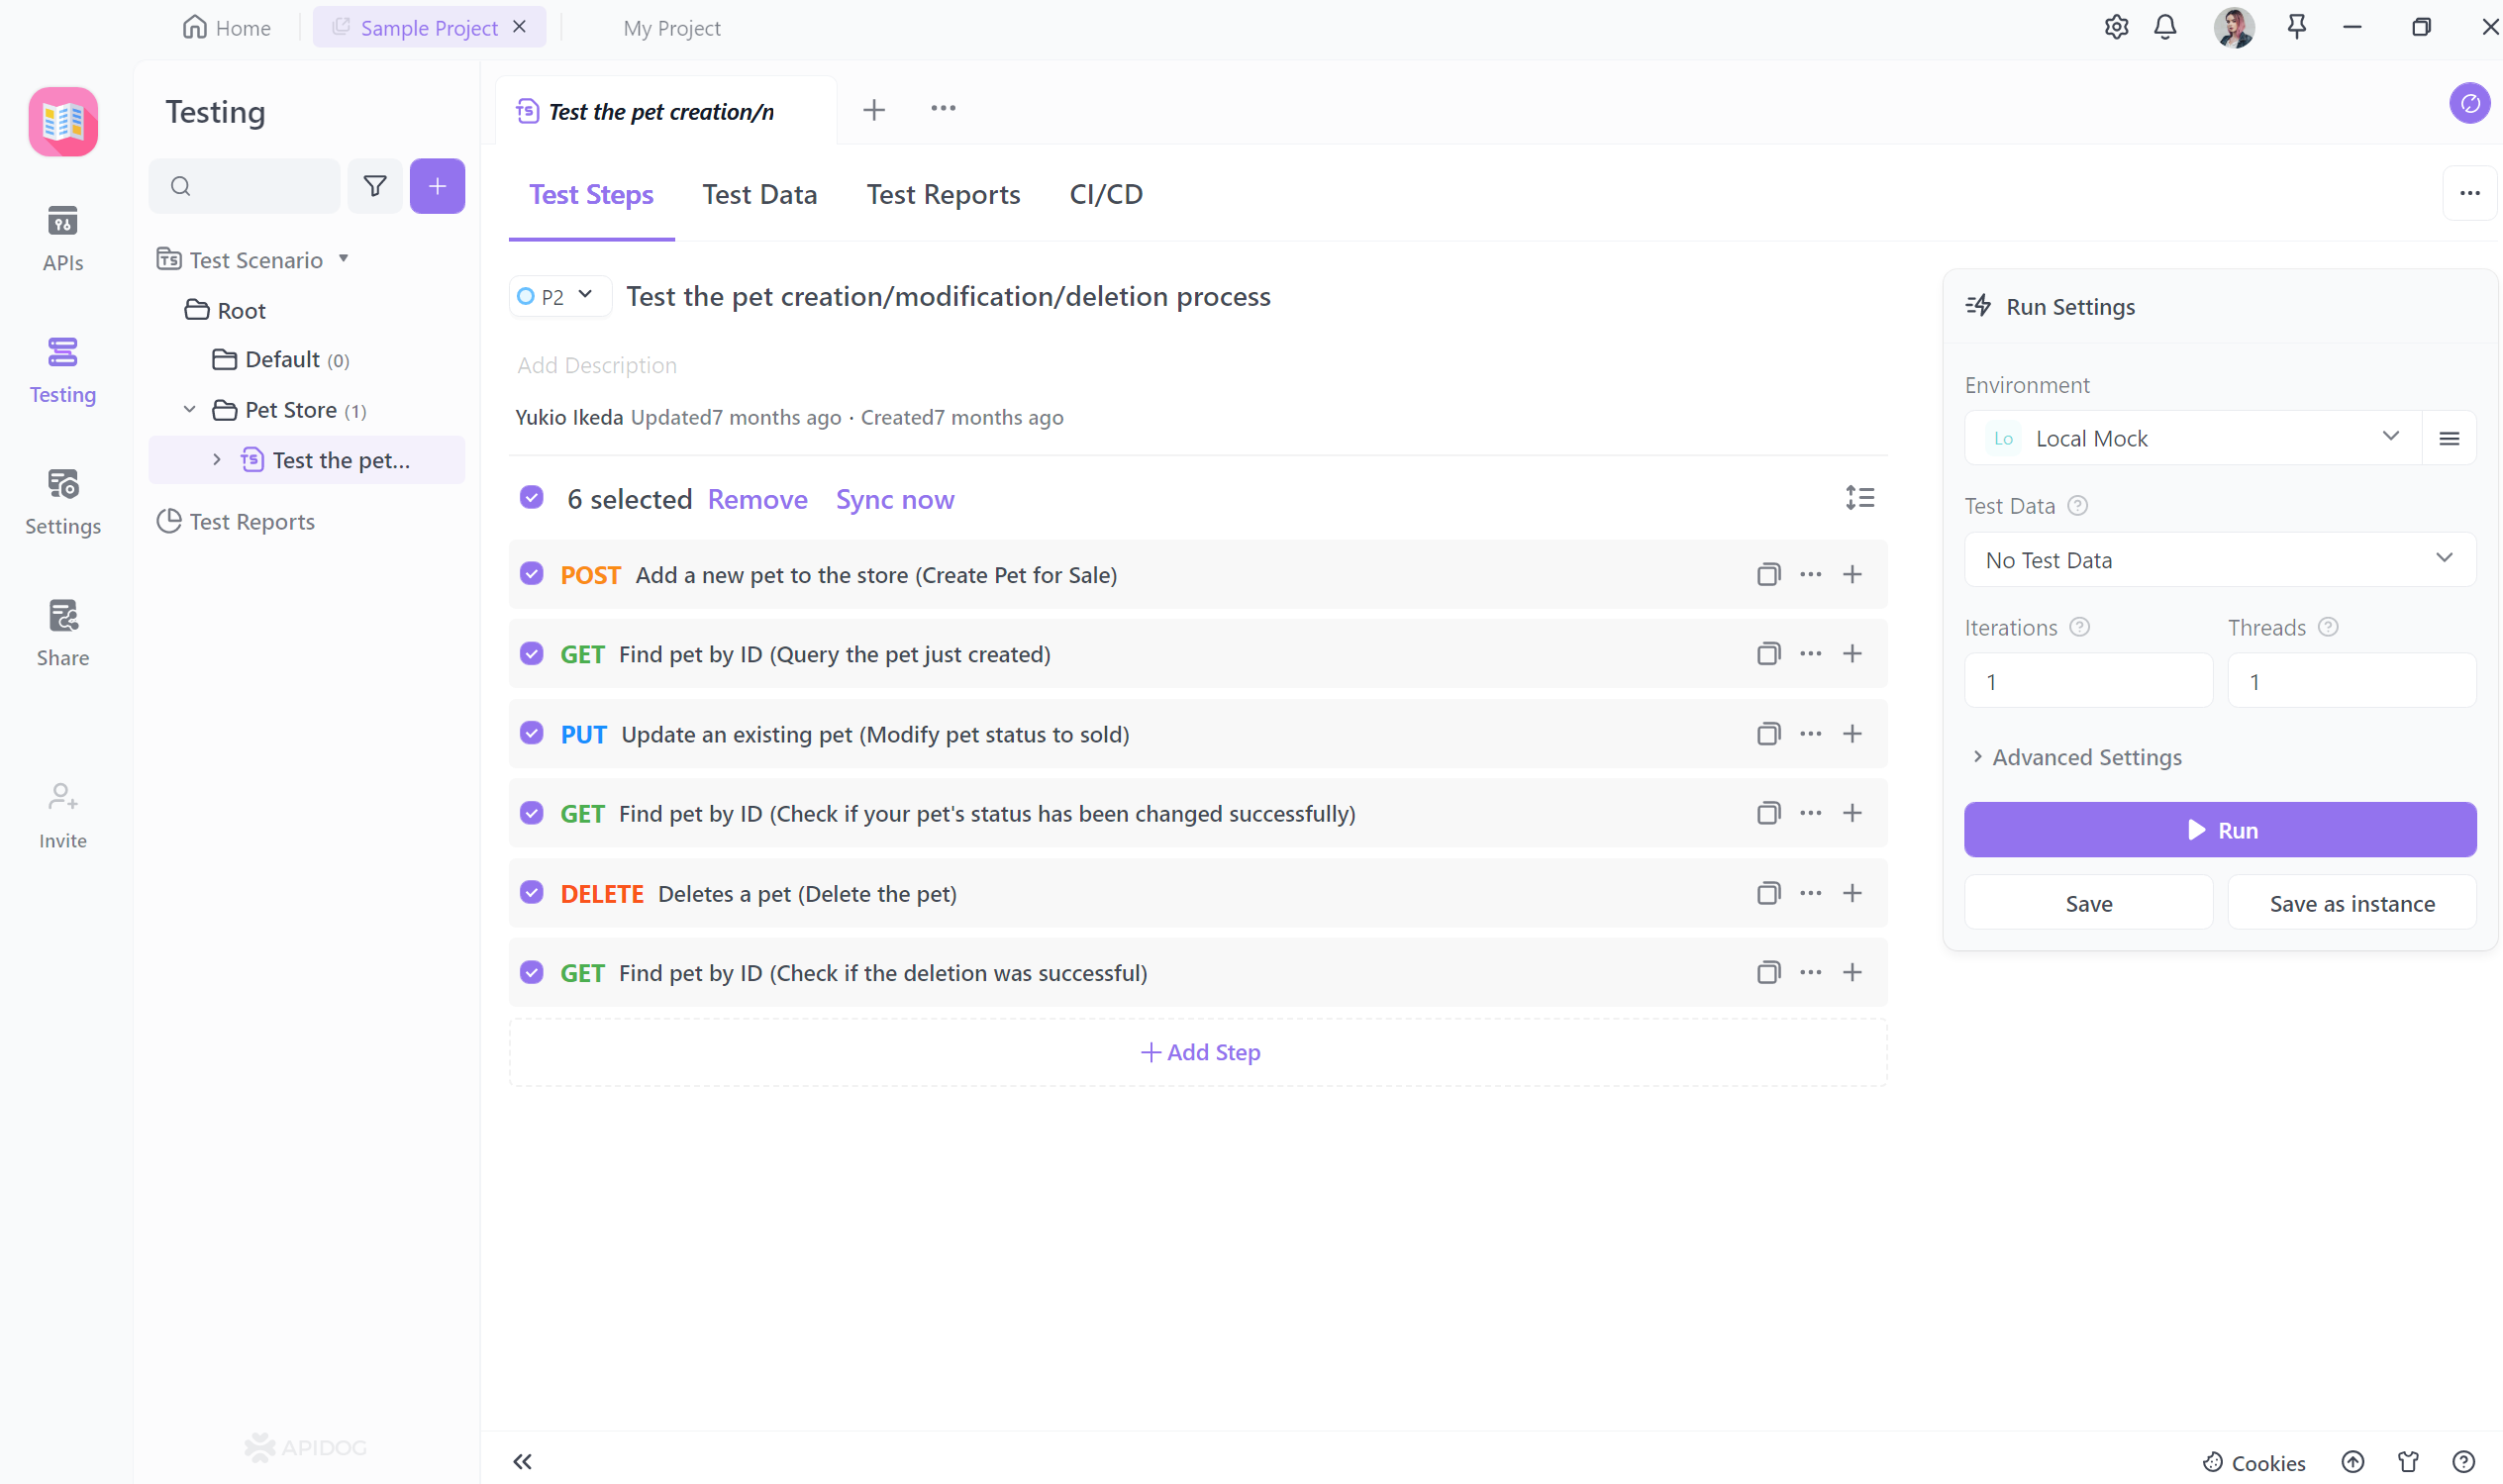
One of the standout features of Apidog's Debug Mode is its ability to facilitate automation testing. As developers make changes or add new features to the API, they can instantly test its functionality. This immediate feedback loop ensures that any issues or bugs are identified and addressed promptly. It reduces the back-and-forth typically associated with the development-testing cycle, leading to faster and more efficient development.
Automated Documentation Creation:
After the debugging process and once the API is deemed stable, there's still the documentation task. However, Apidog removes the manual labor involved in this step with Debug Mode. The system is designed to automatically generate detailed and accurate documentation based on the finalized API. It ensures consistency and saves developers a significant amount of time. They no longer need to manually document each function, endpoint, or feature, as Apidog handles it seamlessly.
Step By Step to Debugging APIs in Apidog
Mock APIs can be used in Apidog for debugging. Debugging using Apidog is an essential skill for any backend developer. We will look at a step-by-step guide to debug your APIs using Apidog.
Step 1. Launch Apidog or sign in for free
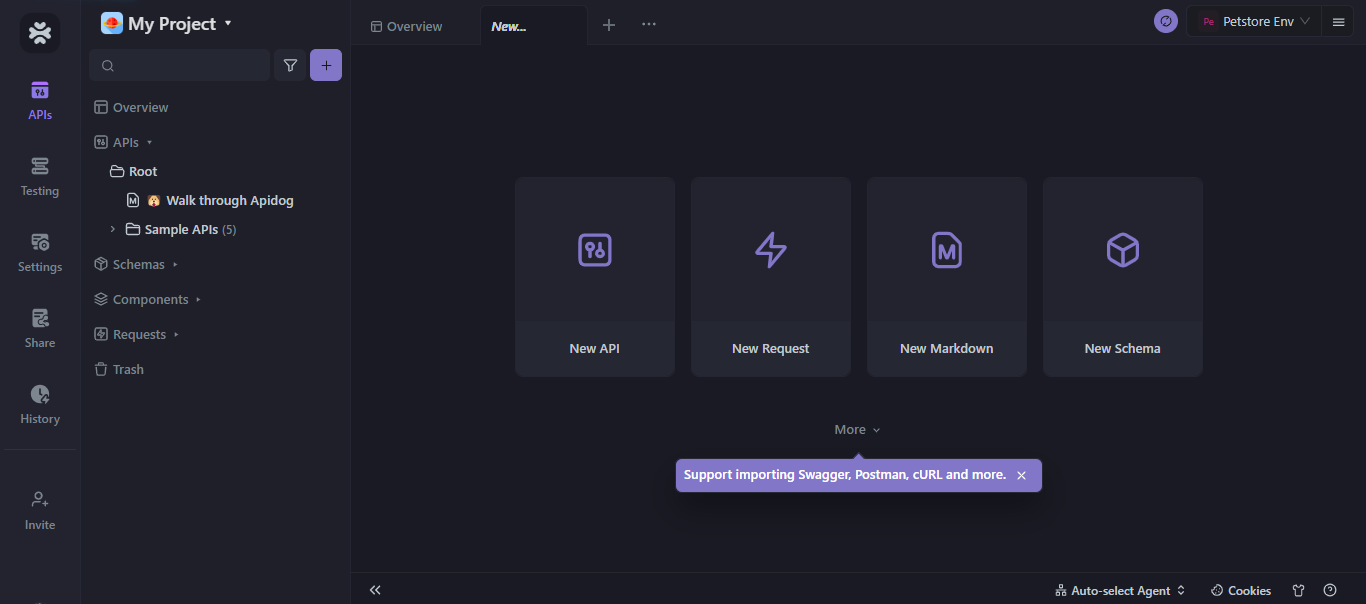
You can start by installing the Apidog application from Apidog's website or sign up and use it online. After installing Apidog, you need to launch it. The following window will open up.
Step 2. Create your Project
Click on the pre-made My Project option, which will take you to the interface to create new APIs, requests, markdowns, and schemas. Click on the New API option to be taken to the API page.
Step 3. Work with Sample or Mock APIs
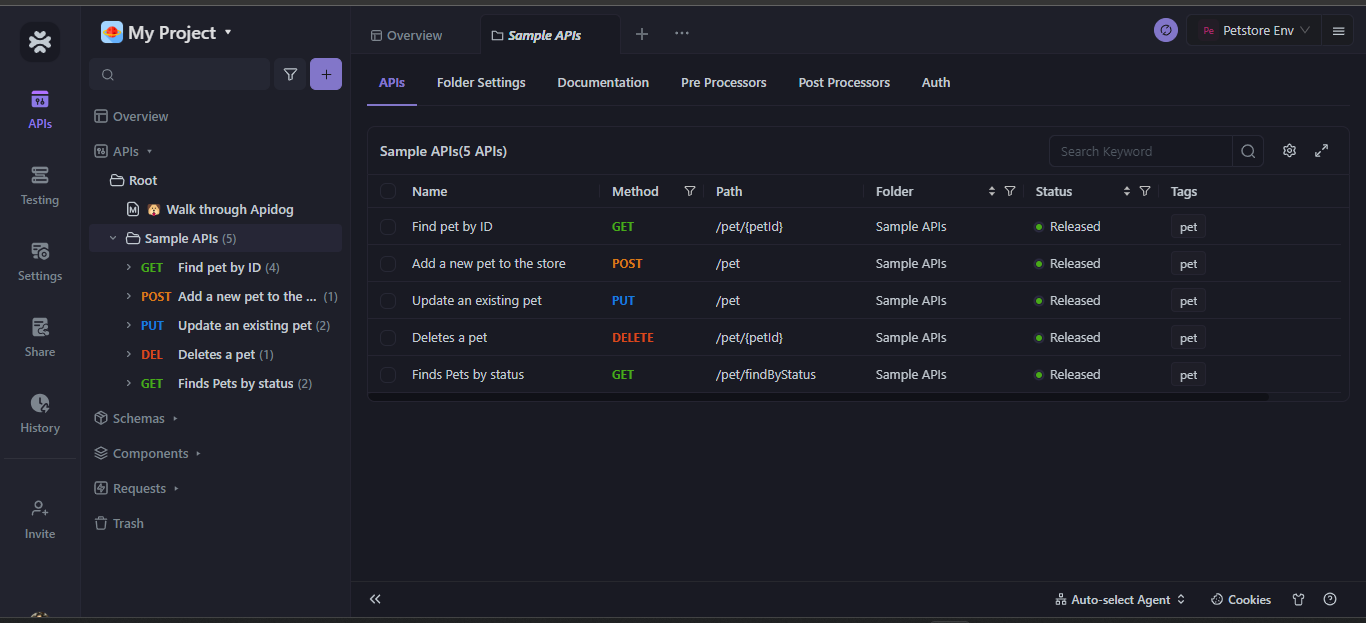
You need to click on the sample APIs option to start working on pre-configured APIs immediately. You will see several options for each of the HTTP request methods. We will click on the GET method to find a pet by their unique ID. Send the request.
Step 4. Start the Debugging Session
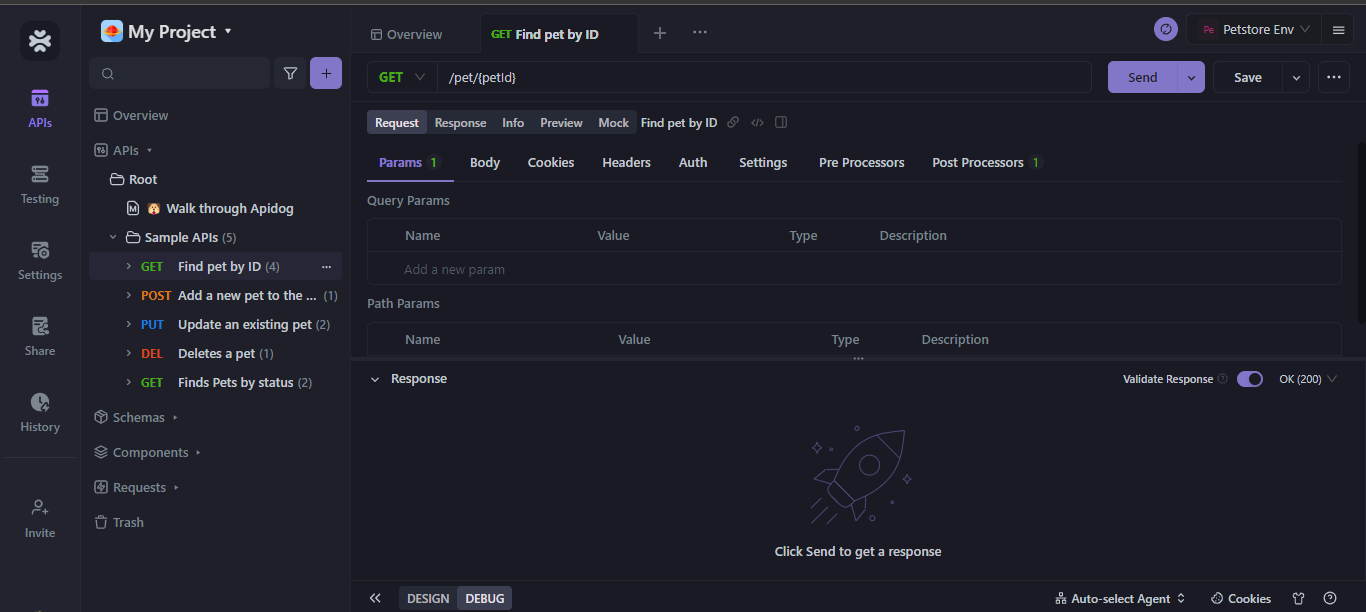
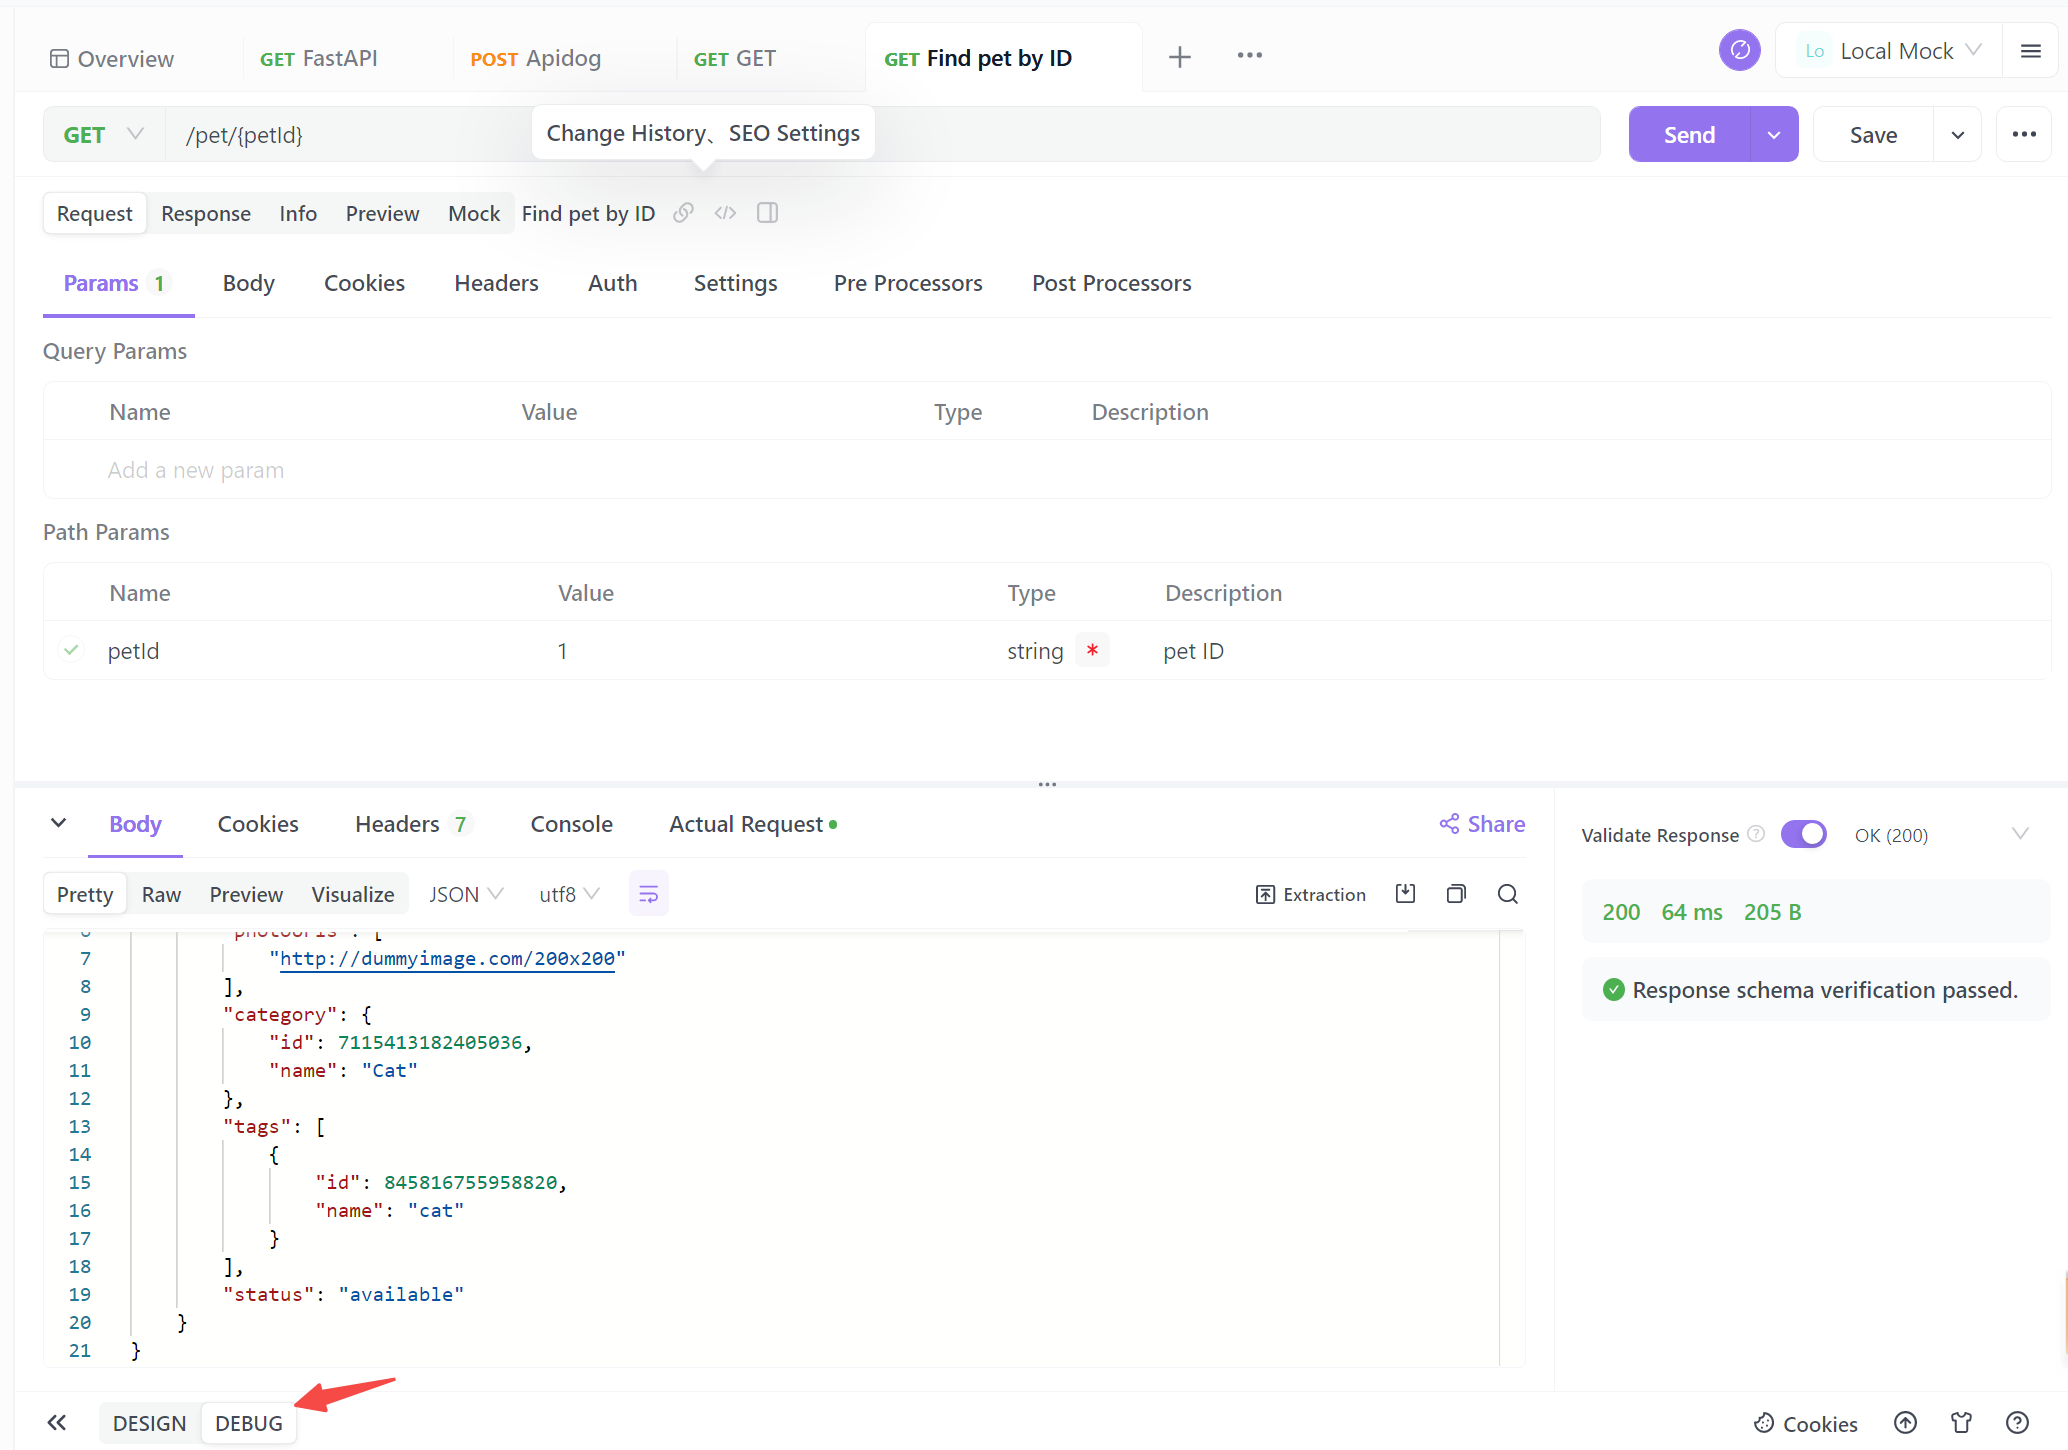
After sending the request, save the API and choose the option of DEBUG at the bottom of the page to start debugging the API by looking at the response.
Step 5. Send the GET Request
Check the status code to validate the request. Apidog will return the Response Definitions and Response Examples, which you can look at to verify if your request had any errors. If there are any errors in the request, the status code will show an error code; otherwise, the code will be shown as 200 OK. The request was found in the GET request I sent, but the ID type was supposed to be a string and not an integer. This error is reflected in the response data.
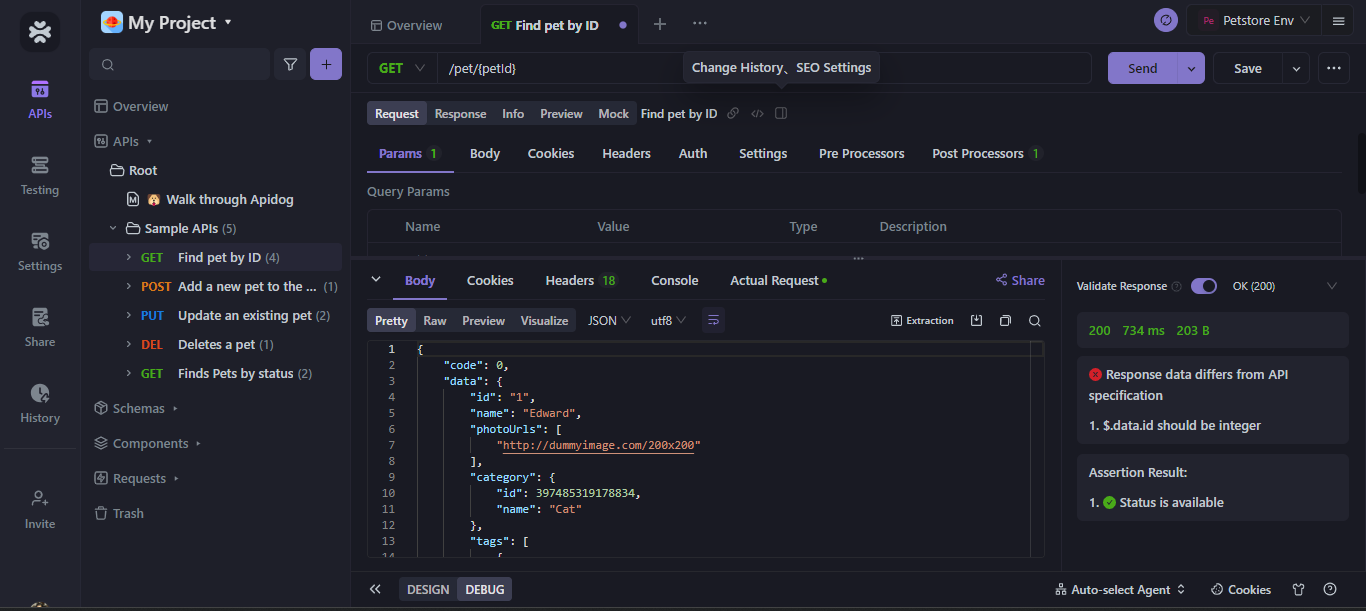
This response data error can be changed by correcting the ID type to a string instead of an integer. This way, the debugger can help us identify where the problem in our API requests lies so we can adjust them according to our needs.
Step 6. Set Expectations
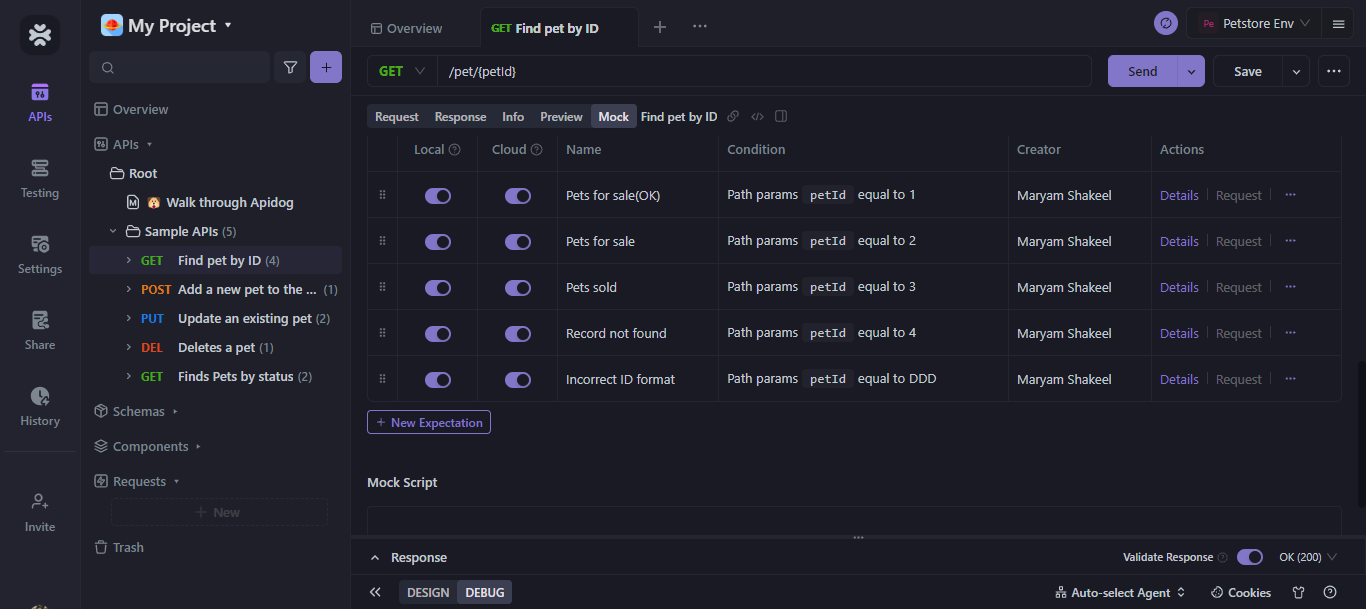
You can set expectations according to your requirements. It will enable you to define when and where an error will be shown if something incorrect happens. For example, if I set the expectation of seeing an error when an incorrect ID format is received, then the debugging response will show an error in that case. Similarly, depending on my needs, I can turn certain expectations off and on.
Why Opt for Apidog's Debug Mode Over Postman?
In API development, having the right tools can make all the difference. Apidog's Debug Mode offers a compelling alternative to traditional tools like Postman, and here's why it's a choice worth considering:
1. Seamless Integration of Code Writing and Debugging:
Apidog allows developers to integrate the process of code writing and debugging seamlessly. In traditional approaches, developers often write code in one environment and switch to a different tool, like Postman, for testing and debugging. Apidog, however, lets you do both in one place, saving you time and reducing the complexity of your workflow.
2. Enhanced Collaboration Within a Unified Platform:
Collaboration is key in modern software development. Apidog provides a unified platform where front-end developers, back-end developers, and testing teams can collaborate seamlessly. With Apidog, you can debug your APIs and perform API Mocking and automation testing—all within the same platform. This fosters better communication, reduces the risk of misunderstandings, and accelerates issue resolution.
3. Simplified Workflow by Reducing Tool Dependency:
Traditional API development often involves using multiple tools for different tasks. For instance, developers may use Swagger for documentation, Postman for testing, and Mock.js for API mocking. Apidog simplifies this workflow by offering a comprehensive solution that covers API design, debugging, mocking, and documentation. Reducing the need for multiple tools streamlines the development process, making it more efficient and user-friendly.
3 Types of Apidog's Modes
Apidog stands out with its intuitive and versatile modes in the vast landscape of API development tools. Each method is tailored to cater to specific stages of the API development process, ensuring a seamless and efficient workflow. Let's delve into the intricacies of these modes and understand how they complement each other.
1. Design Mode: Crafting the Blueprint
The "Design Mode" in Apidog is akin to an architect's drafting table. It's where the initial blueprint of the API is laid out. Developers can design, save, and modify their APIs in this mode, setting the foundation for the subsequent stages of development.
Key Features:
- Intuitive Interface: The design mode offers a user-friendly interface, allowing developers to easily define endpoints, set parameters, and outline response structures.
- Collaboration: Multiple team members can work together, making real-time changes and ensuring everyone is on the same page.
2. Debug Mode: The Testing Ground
Once the design is in place, it's time to test its functionality, and that's where the "Debug Mode" shines. Think of it as a controlled environment where the API is put through its paces, ensuring it performs as expected.
Key Features:
- Real-time Testing: Developers can send requests and receive responses in real-time, quickly identifying any issues or bottlenecks.
- Automatic Documentation: As the API is debugged and refined, Apidog automatically generates documentation, ensuring it's always up-to-date with the latest changes.
- Synchronization with Design Mode: Any changes made in the Debug Mode can be seamlessly synchronized with the Design Mode. This ensures that the design and functionality of the API are always aligned.
3. Quick Request Mode: On-the-Fly Testing
For those moments when developers need to make a quick API call without diving deep into the design or debugging process, Apidog offers the "New Request" mode. It's a streamlined interface designed for swift and hassle-free API requests.
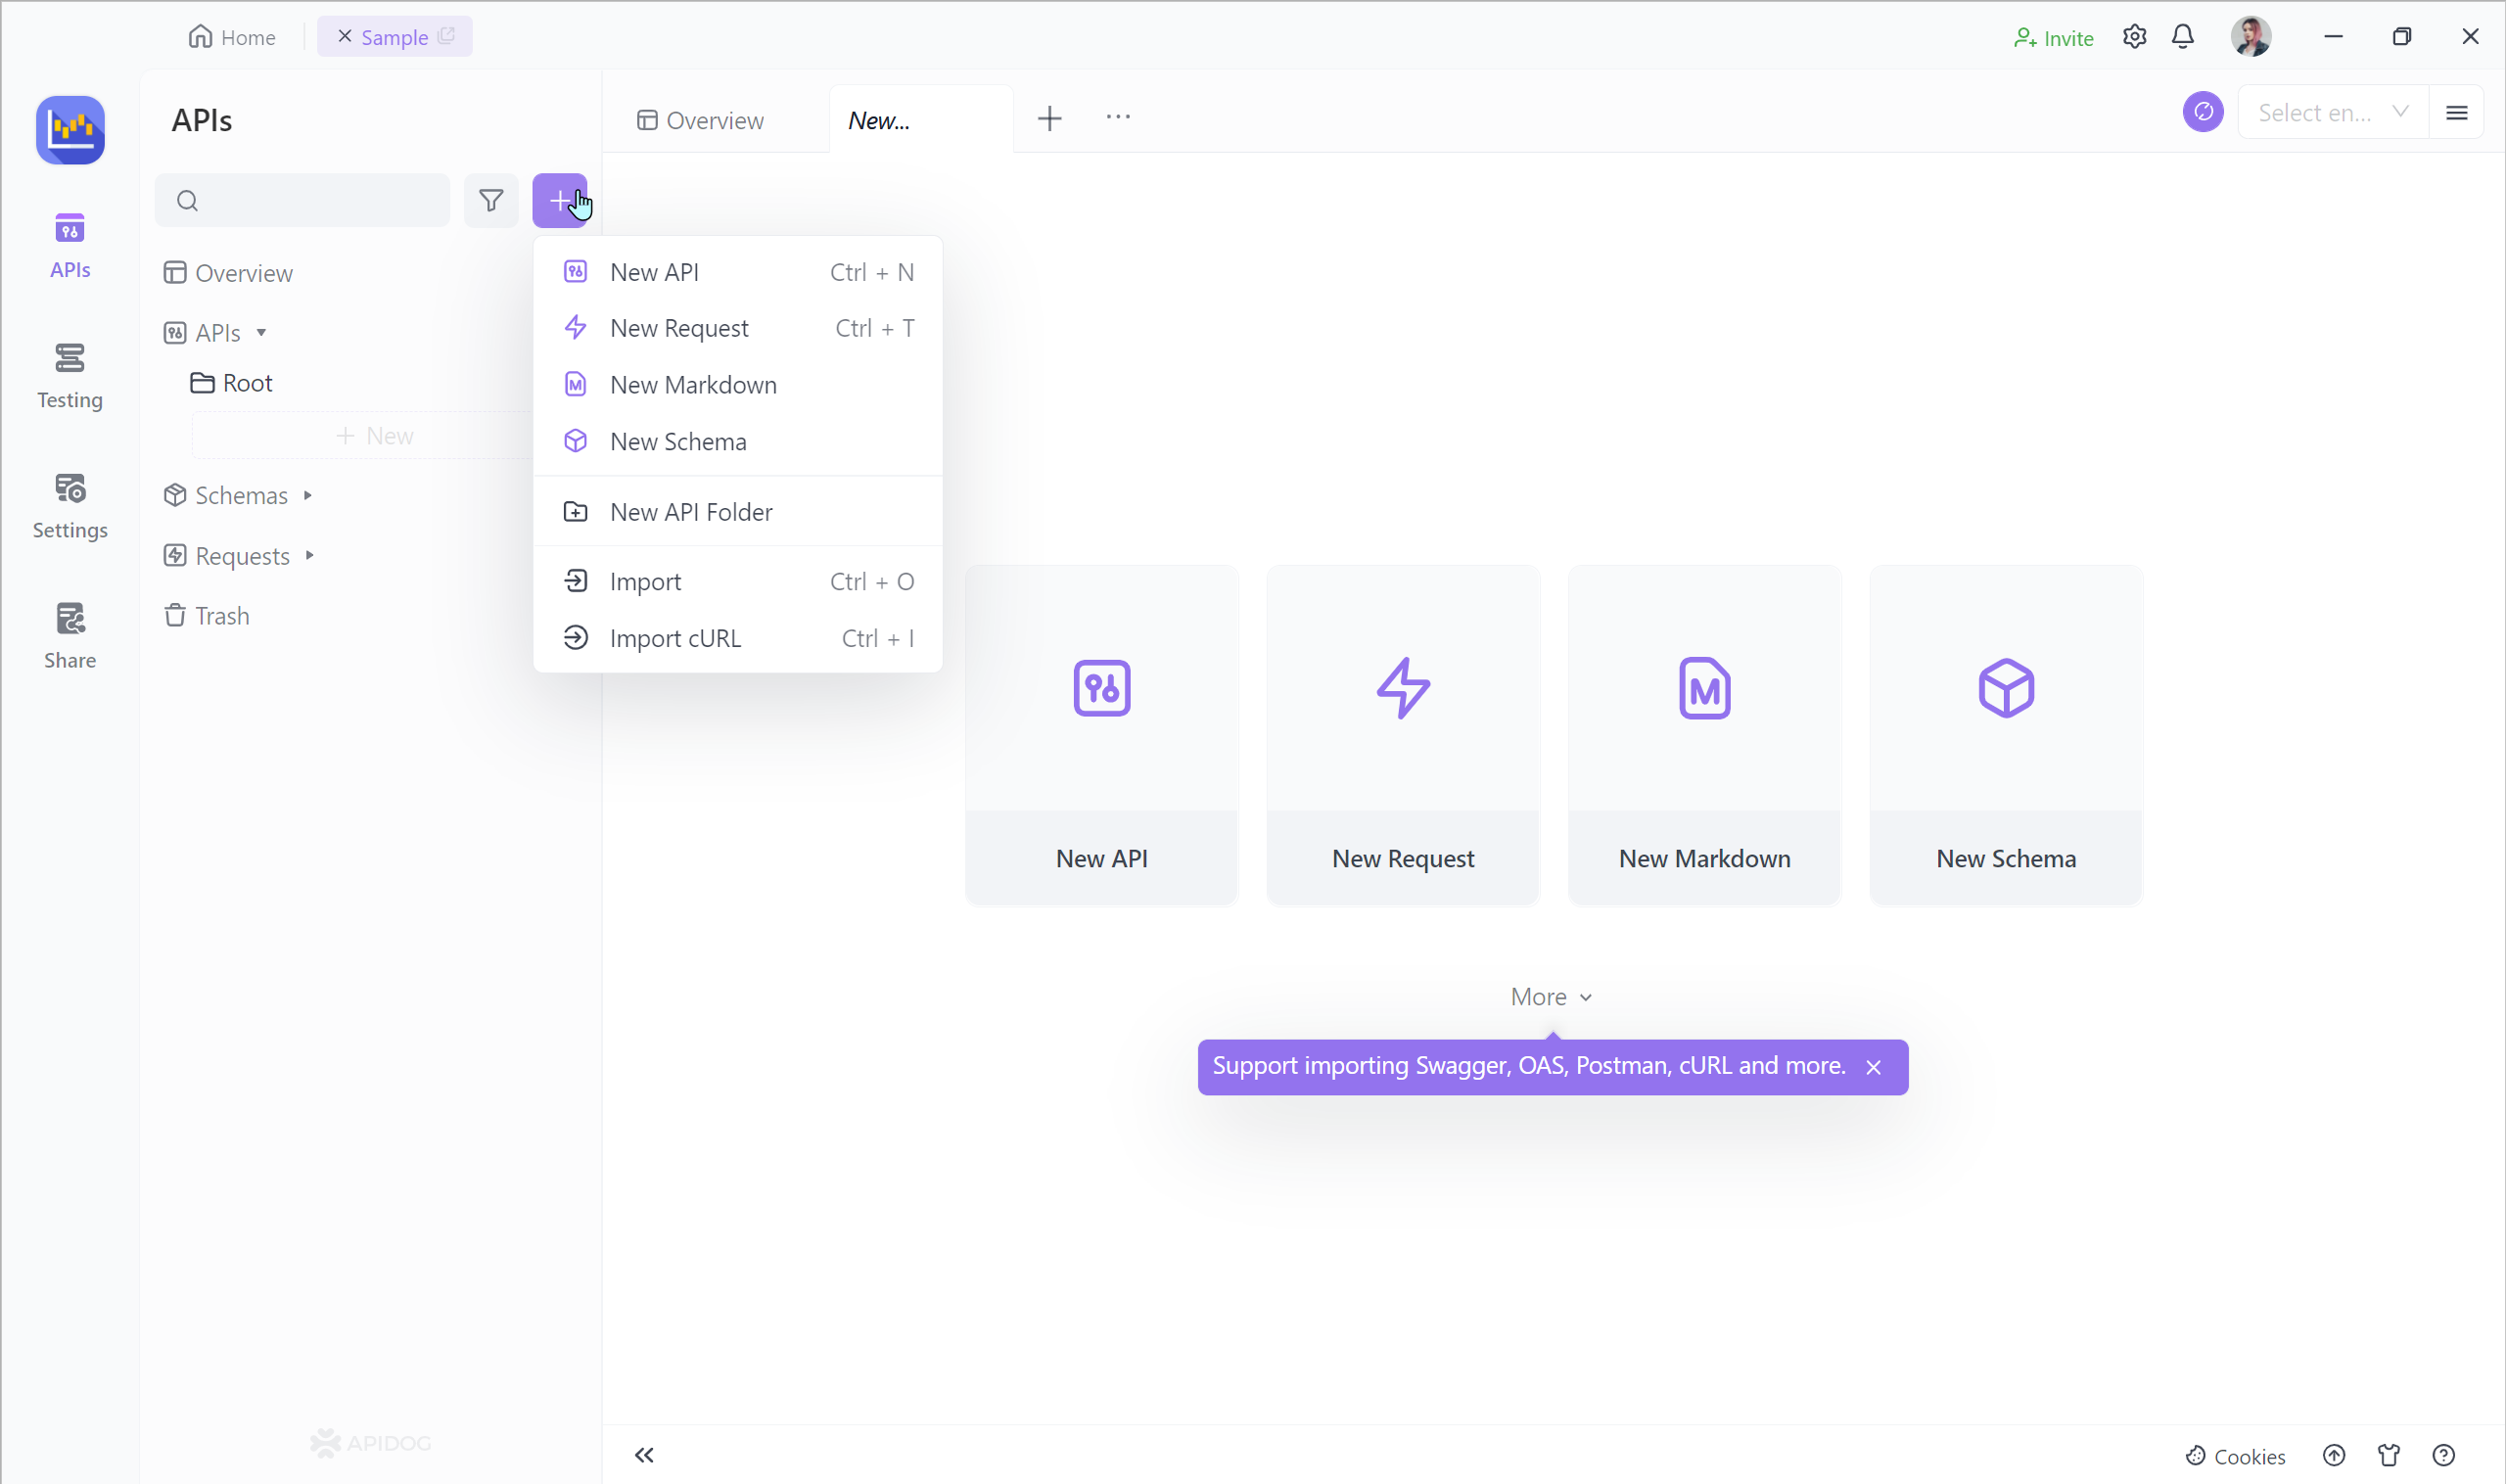
Key Features:
- Rapid Testing: Perfect for making quick API calls, checking responses, or verifying endpoints without extensive setup.
- User-friendly Interface: With a minimalistic design, developers can easily input their request parameters and get results in seconds.
Synchronization for Flexibility:
One of Apidog's standout features is the seamless synchronization between the Debug and Design Mode. As developers switch between designing and testing, the platform ensures that data is consistently updated across both modes. It provides flexibility and ensures harmonization of the API's design and functionality. Whether making changes to the API's structure or refining its behavior, developers can transition between modes with the assurance that their work is always synchronized.
Conclusion
In today's world, even a minute error in applications can lead to heavy losses; hence, developers must keep debugging the code to remove all errors and discrepancies. Apidog is one of the most valuable tools to help with that. It provides a debugging environment and ensures the user knows where the error occurs. It is an excellent tool for all backend developers to assist them in the process of debugging while also being able to collaborate with peers and document their debugging journey for later visits.


