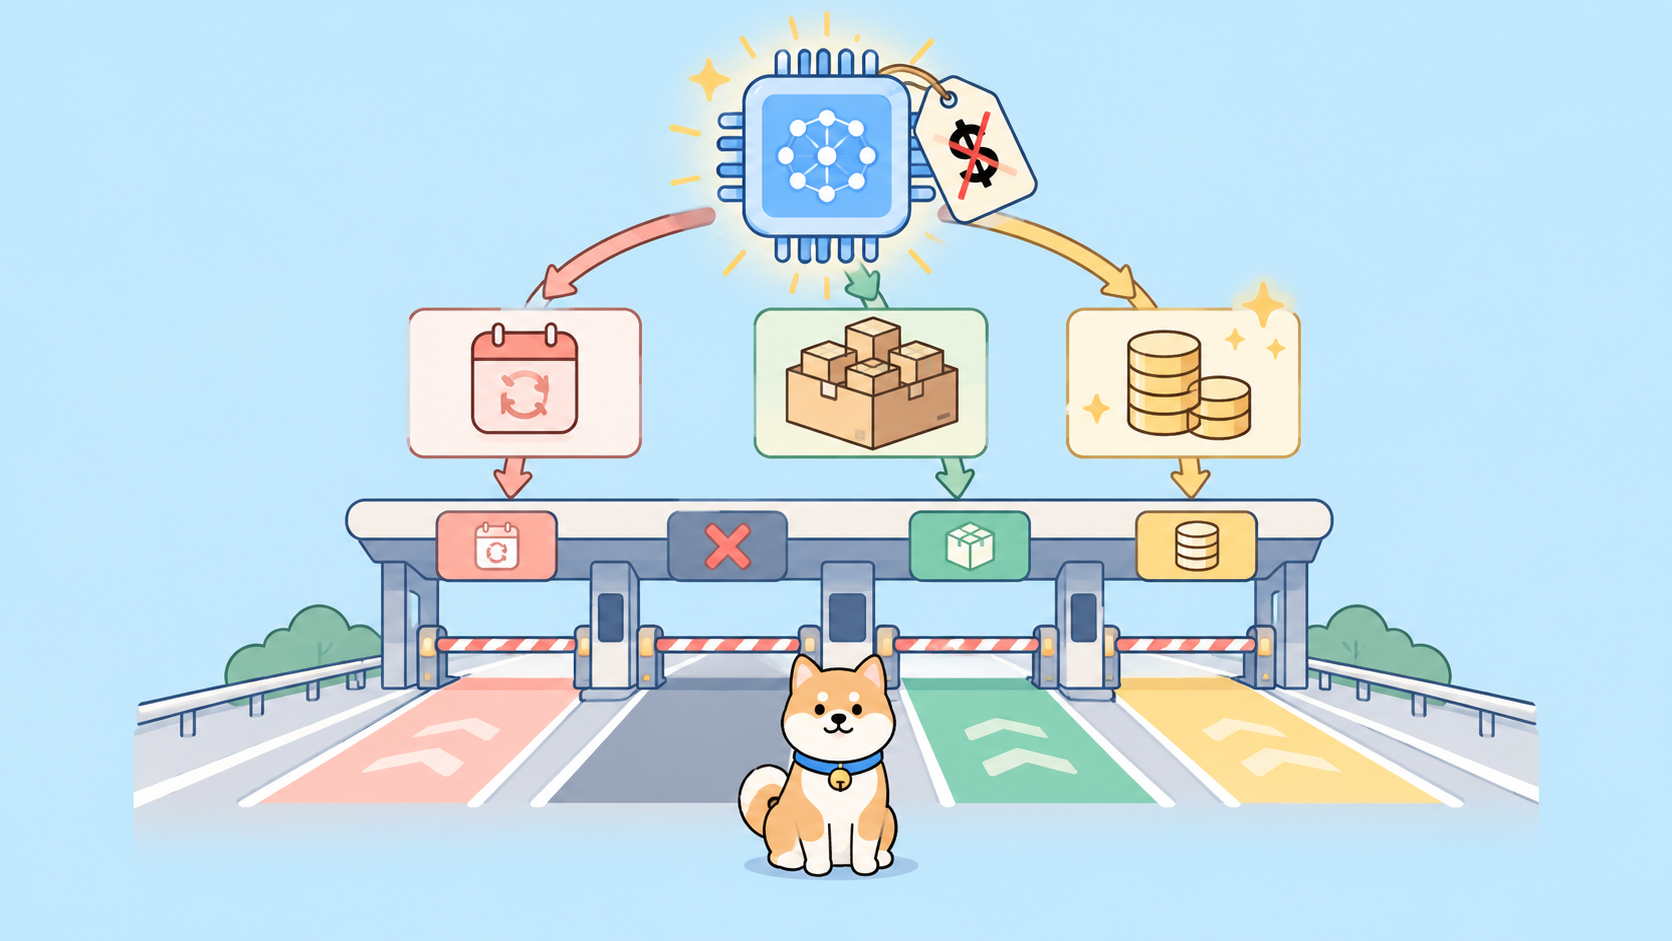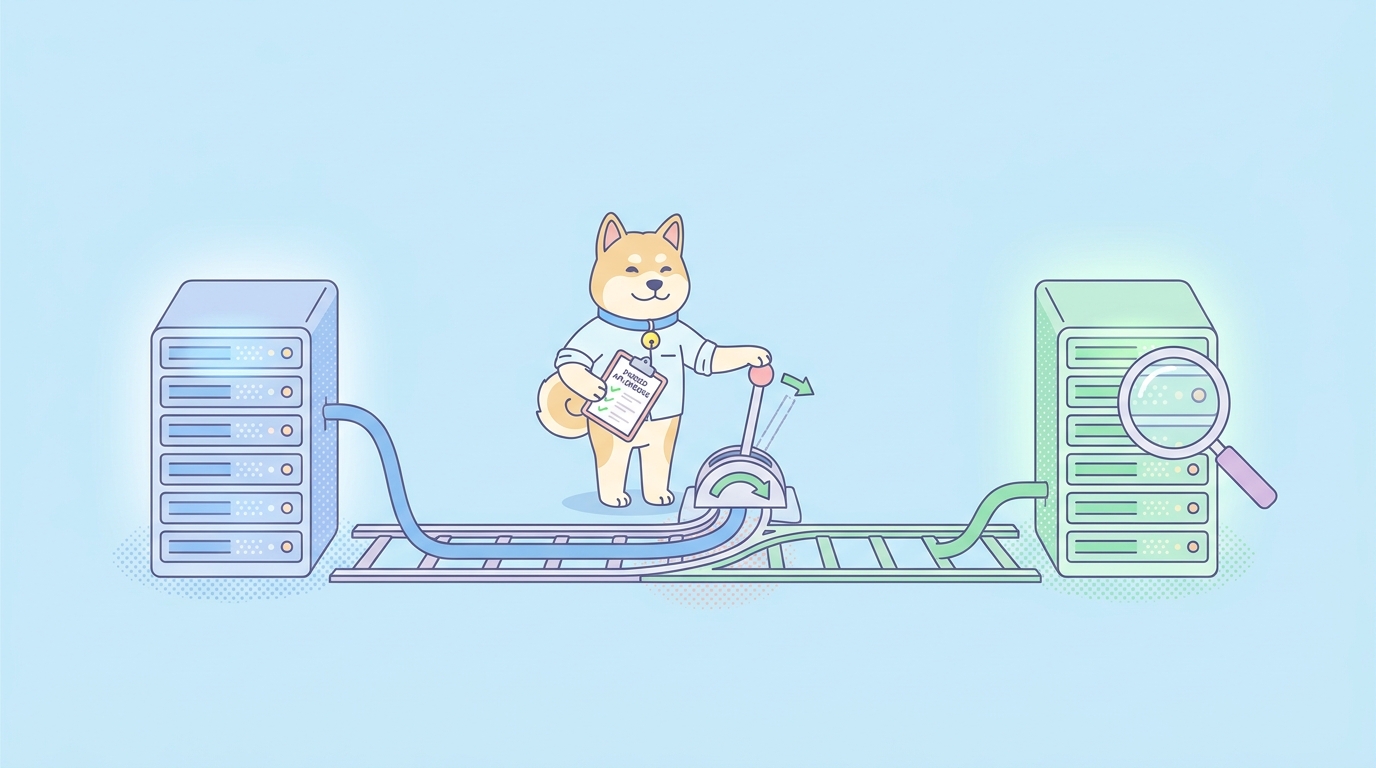
Blue-green deployment promises zero-downtime releases: you stand up a fresh copy of your service, send it some traffic, and switch over once it looks healthy. The problem is the word “healthy.” A load balancer health check usually pings one endpoint and waits for a 200. That tells you the process is up. It tells you nothing about whether your new build returns the right JSON, honors the same contract, or still authenticates a token the way the old version did. So you flip the switch, and the first real user finds the bug your health check could not see.
This guide walks through how to test the green environment like a user would before any production traffic reaches it. You’ll run a full suite of API tests against the idle stack, gate the cutover on those results, and wire the whole thing into your pipeline so it happens on every deploy. We’ll use Apidog and the Apidog CLI as the testing layer, because the same test scenarios you build in the desktop app can run unattended in CI against whichever environment you point them at.
If you already practice blue-green but treat the verification step as “click around for a minute,” this is the part that turns it into something you can trust. The whole point of running two identical environments is to validate one of them under realistic conditions. A health check is the floor, not the ceiling.
TL;DR
Blue-green deployment runs two identical production environments and switches a router between them. Before you flip traffic from blue (live) to green (new), run your full API test suite against green directly. Gate the cutover on a green build of the suite. With the Apidog CLI, point the same test scenarios at the green base URL in your pipeline, fail the deploy if any assertion breaks, and only then switch the router. Health checks confirm a process is up; API tests confirm the contract still holds.
What blue-green deployment actually is
Blue-green deployment is a release pattern that keeps two production-grade environments side by side. One serves live traffic (call it blue). The other sits idle, ready to receive the next version (green). You deploy the new build to green, verify it, then change a single switch (a load balancer target, a DNS record, a Kubernetes service selector) so all traffic now flows to green. Blue becomes the idle standby for the next release. If something breaks, you flip back to blue in seconds.
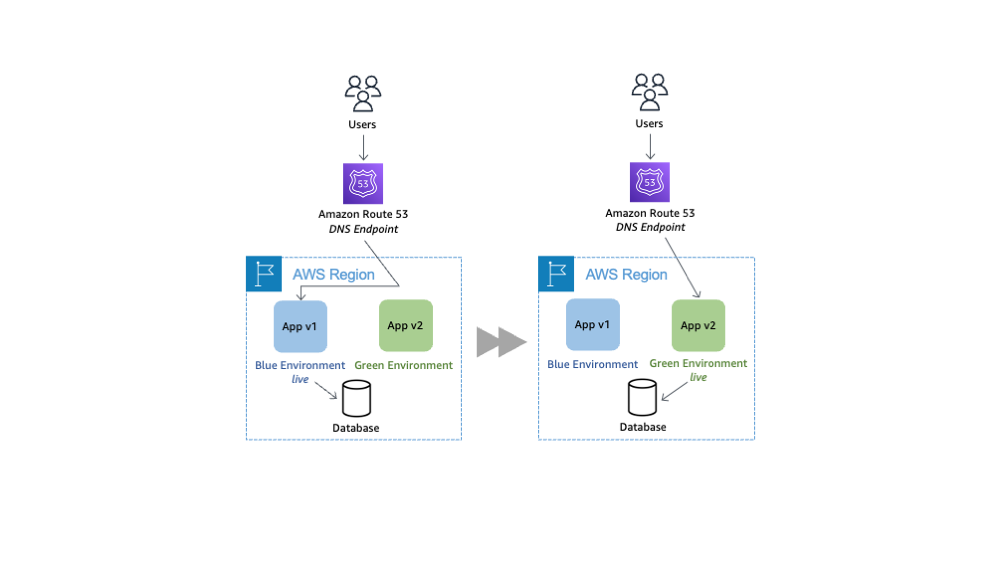
The appeal is obvious. There’s no maintenance window. The cutover is near-instant. And rollback is the cheapest it will ever be, because the previous version is still running and warm. Compare that to a rolling deployment, where you replace instances in place and a bad build is already serving a slice of users by the time you notice.
But the pattern only pays off if the green environment is genuinely ready when you switch. That readiness check is where most teams under-invest. They confirm green boots and passes a shallow /health ping, then cut over and hope. The shape of blue-green deployment makes a thorough check easy. Green is fully deployed and reachable, just not receiving public traffic, so there’s no excuse to skip it. You have a complete, isolated copy of production sitting right there waiting to be tested.
If you want the broader release-strategy vocabulary first, our breakdown of continuous delivery vs continuous deployment vs continuous integration sets the context for where blue-green fits.
Why a health check is not a test
Here’s the gap that bites teams. A typical health check looks like this:
# Load balancer health probe
GET /health -> 200 OK -> mark target healthy
That endpoint usually returns a hardcoded {"status":"ok"}. It does not touch your database. It does not exercise auth. It does not serialize a real resource. A build can pass this probe while every business endpoint returns a 500, a malformed payload, or yesterday’s schema.
Consider the failure modes a /health ping will happily wave through:
- A migration that didn’t run, so
GET /orders/{id}throws on a missing column. - A renamed JSON field (
user_idbecameuserId) that breaks every downstream consumer. - An auth change that now rejects tokens the mobile app is still issuing.
- A dependency version bump that changes date formatting from ISO 8601 to a Unix timestamp.
- A new required header that returns
400for any client that doesn’t send it.
None of these stop the process from booting. All of them break real users the instant you flip traffic. The fix is not a smarter health check; it’s a real test suite that calls your endpoints the way clients do, asserts on status codes, response bodies, schemas, and latency, then reports pass or fail. This is the same discipline behind API contract testing; you’re checking that the running service still matches the agreement consumers depend on.
The blue-green testing workflow, end to end
Here’s the sequence we’re building toward. The new step is “test green,” and it sits between deploy and switch.
- Deploy to green. Push the new build to the idle environment. It comes up reachable at an internal address, for example
https://green.internal.example.com, but no public traffic hits it yet. - Smoke test green. Run a fast subset of critical-path requests against green. Login, fetch a core resource, create one. If any fail, stop here. Blue is still serving users and never noticed.
- Run the full suite against green. Execute your complete API test scenarios (happy paths, error cases, auth flows, schema assertions) pointed at the green base URL.
- Gate the cutover. If the suite passes, proceed. If anything fails, the pipeline stops and green is torn down or left for inspection. Production is untouched.
- Flip the switch. Repoint the router (load balancer, DNS, or service selector) from blue to green.
- Verify in production. Run the same smoke test against the live URL post-cutover to confirm the switch took effect cleanly.
- Keep blue warm. Hold the old environment for a rollback window. If post-switch monitoring goes sideways, flip back instantly.
The trick is that steps 2, 3, and 6 use the same test definitions. You build the scenarios once and change only the base URL the runner targets. That’s the capability we’ll set up next.
Building the test scenarios in Apidog
Before automating anything, you need a test suite worth running. Apidog lets you build that visually, then run it from the command line without rewriting a thing. Download Apidog and create a project for the service you’re deploying.
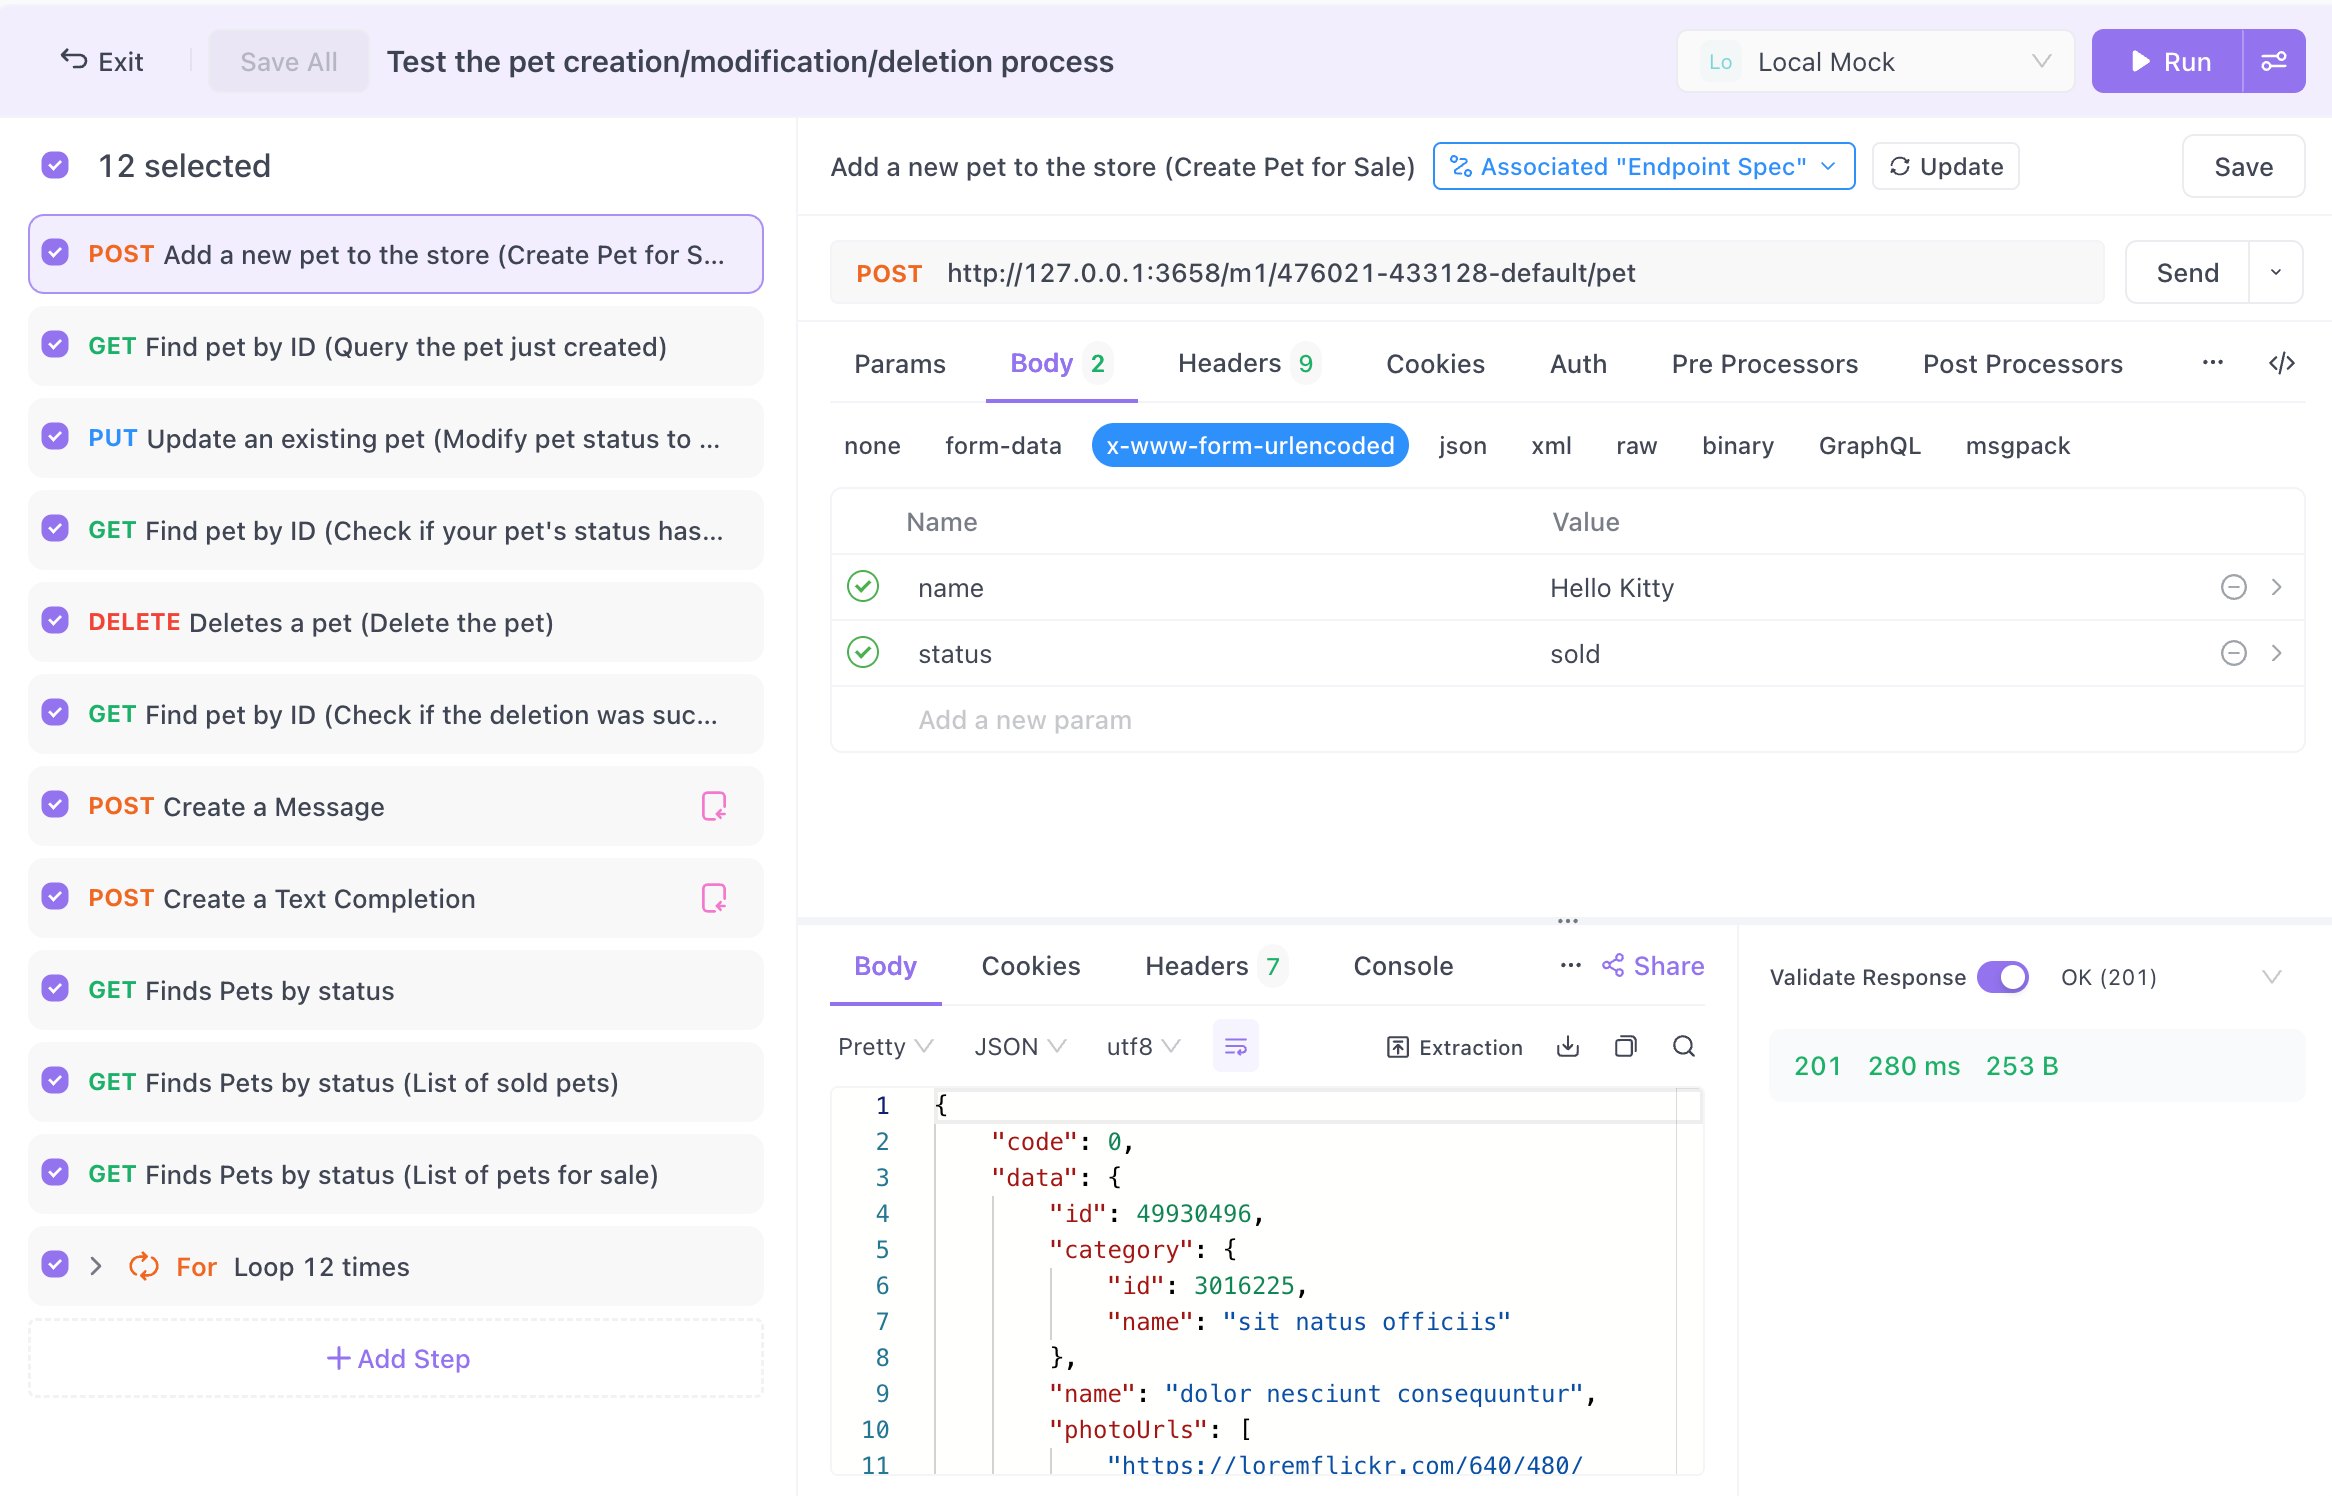
Inside a project, you assemble test scenarios from your existing API endpoints. A scenario is an ordered set of requests with assertions and variable passing between steps. For a blue-green readiness suite, you want scenarios that mirror what real clients do, not just one-off pings.
A practical starter set for an orders service:
- Auth flow:
POST /auth/loginwith valid credentials, assert200, extract the bearer token into a variable, then use it in every following request. - Read path:
GET /orderswith the token, assert200, assert the response is an array, assert each item hasid,status, andtotal. - Single resource:
GET /orders/{id}, assert the schema matches your OpenAPI definition, asserttotalis a number greater than zero. - Write path:
POST /orderswith a valid body, assert201, assert the returnedidis non-empty, thenGETthat new id back to confirm it persisted. - Negative cases:
GET /orders/{id}with an invalid token, assert401.POST /orderswith a missing required field, assert400.
Two features matter most for catching the failures a health check misses. First, schema assertions: Apidog can validate a response against the JSON Schema or OpenAPI definition for that endpoint, so a renamed or retyped field fails the test instead of slipping into production. Second, response assertions on specific values, headers, and response time, so you catch the subtle drift: a date format change, a null where you expected a number, a latency regression.
The key design decision is environment handling. Don’t hardcode https://blue.example.com into your requests. Define an environment variable for the base URL and reference it everywhere as {{baseUrl}}. In Apidog you set up environments (Production, Green, Local) and switch the active one, or you override the base URL at run time from the CLI. This is the same environment-and-secrets discipline covered in our guide to an API client with environment and secrets management; your tests stay identical across blue and green, only the target moves.
If you want to bundle these scenarios into a single runnable unit, Apidog’s test suites group multiple scenarios so one command runs the whole readiness check.
Running the suite from the command line
The desktop app is where you build and debug scenarios. The CLI is what runs them in your pipeline against the green environment. Install it with npm; you need Node.js v16 or later:
npm install -g apidog-cli
The runner executes a test scenario from a CI configuration. In Apidog, you generate a CI config for a test scenario, which gives you a run command tied to an access token. The basic shape:
apidog run "https://api.apidog.com/api/v1/api-test/ci-config/<config-id>/detail?token=<token>" \
  -r html,cli \
  --out-file green-readiness
The -r flag selects reporters. cli prints results to the terminal so your pipeline log shows exactly which assertion failed. html writes a self-contained report you can archive as a build artifact for whoever reviews the deploy. There’s also a JSON reporter when you want to feed results into another tool. The --out-file flag names the output so each run is traceable to a build.
For pointing the suite at green specifically, the runner accepts an environment flag so the same scenario runs against different targets:
# Test the green (idle) environment before cutover
apidog run "<ci-config-url>" \
  --environment <greenEnvironmentId> \
  -r cli,html \
  --out-file green-pre-switch
You can also drive runs entirely from exported scenario files when you’d rather keep everything in the repo and avoid a network call to fetch the config:
apidog run --exported-data ./tests/orders-readiness.json \
  --variables ./tests/green.variables.json \
  -r cli
For a deeper tour of the runner and its options in a pipeline context, see how to automate API tests in CI/CD. The behavior that matters for blue-green is the exit code: when an assertion fails, the CLI exits non-zero. That single fact is what lets you gate the cutover. A non-zero exit stops the pipeline before the switch step ever runs.
Wiring it into a GitHub Actions pipeline
Here’s the verification step inside a deploy workflow. This assumes an earlier job already deployed the build to green and that green is reachable from the runner. The job tests green, and only a passing run lets the next job perform the switch.
name: deploy-blue-green

on:
  push:
    branches: [main]

jobs:
  deploy-green:
    runs-on: ubuntu-latest
    steps:
      - uses: actions/checkout@v4
      - name: Deploy build to green environment
        run: ./scripts/deploy-green.sh
      # green is now reachable at https://green.internal.example.com

  test-green:
    needs: deploy-green
    runs-on: ubuntu-latest
    steps:
      - uses: actions/checkout@v4
      - uses: actions/setup-node@v4
        with:
          node-version: '20'
      - name: Install Apidog CLI
        run: npm install -g apidog-cli
      - name: Run readiness suite against green
        run: |
          apidog run "${{ secrets.APIDOG_CI_CONFIG_URL }}" \
            --environment "${{ vars.GREEN_ENV_ID }}" \
            -r cli,html \
            --out-file green-readiness
      - name: Archive HTML report
        if: always()
        uses: actions/upload-artifact@v4
        with:
          name: green-readiness-report
          path: ./green-readiness.html

  switch-traffic:
    needs: test-green        # only runs if test-green passed
    runs-on: ubuntu-latest
    steps:
      - uses: actions/checkout@v4
      - name: Flip router from blue to green
        run: ./scripts/switch-to-green.sh
      - name: Smoke test production URL post-switch
        run: |
          npm install -g apidog-cli
          apidog run "${{ secrets.APIDOG_SMOKE_CONFIG_URL }}" \
            --environment "${{ vars.PROD_ENV_ID }}" \
            -r cli
The dependency chain does the gating for you. switch-traffic lists needs: test-green, so if the readiness suite fails, the switch job never starts. Green stays idle, blue keeps serving, and nobody downstream is affected. The if: always() on the artifact upload means you get the HTML report even on a failure, which is exactly when you want to read it.
Store the CI config URL and token as repository secrets, never inline. The environment IDs can live as repository variables since they’re not sensitive. If your team runs on GitLab, Jenkins, CircleCI, or Azure Pipelines, the structure is identical: a test stage that exits non-zero blocks the switch stage. Our walkthrough of automating API tests in GitHub Actions covers the runner setup in more detail, and the same pattern transfers to any of these platforms.
Smoke test first, full suite second
Running the entire suite against green is the right gate, but you don’t want to discover a totally broken build at minute eight of a twelve-minute run. Split verification into two passes.
The smoke test is a tiny scenario of three to five requests covering the critical path. Login, read one resource, create one, read it back. Run it first. If green can’t do these, the full suite is a waste of time and you should fail fast. Keep this under thirty seconds.
The full suite runs only after the smoke test passes. This is where the breadth lives: every endpoint, error cases, edge cases, schema validation on every response, auth permutations, pagination, rate-limit headers. It’s slower and that’s fine, because it’s the last gate before real users.
This two-tier approach is the same logic behind test scenario vs test case thinking: the smoke scenario is a fast confidence signal, the full suite is exhaustive coverage. Both point at the same green base URL; they differ only in how much they cover and when they run.
A note on test data. Green is a production environment, so be deliberate about what your write-path tests create. Either point write tests at a dedicated test account whose records you clean up, or run them against a green instance backed by a staging database before the data layer is promoted. Verifying behavior without polluting production data is the line you have to walk, and it’s worth understanding the difference between a sandbox vs a test environment when you design this.
Common mistakes that defeat the whole point
Teams adopt blue-green and still ship breakage. Usually it’s one of these.
- Testing blue instead of green. If your suite points at the live URL, you’re testing the version already in production, not the one you’re about to release. Always target the green base URL explicitly before the switch.
- Only checking status codes. A
200with the wrong body is still a broken response. Assert on the payload shape and key values, not just the HTTP status. Schema assertions are what catch field renames and type changes. - Skipping the negative cases. A build that returns
200for an invalid token is a security regression a happy-path test will never catch. Include the401,403, and400cases in the gate. - No rollback discipline. Blue-green’s superpower is instant rollback, but only if you keep blue warm. Don’t tear it down the second green goes live. Hold it through your monitoring window.
- Hardcoded URLs in test requests. The moment a base URL is baked into a request, you’ve lost the ability to run the same suite against green and blue. Use an environment variable for the host, every time.
- Treating the health check as the gate. The whole article, in one line. The probe tells the load balancer a process exists. Your API tests tell you the contract holds.
Blue-green versus canary: where testing fits
Blue-green isn’t the only zero-downtime strategy, and the testing approach shifts with each.
| Strategy | How traffic moves | Where API testing fits |
|---|---|---|
| Blue-green | All at once, blue to green | Full suite against green before the switch; the gate is pre-cutover |
| Canary | Gradually, small % to new version | Continuous assertions on the canary slice; promote on clean metrics |
| Rolling | Instance by instance, in place | Per-instance smoke checks; harder to gate because rollout is already underway |
| Recreate | Stop old, start new (with downtime) | Suite runs during the window; downtime is the trade-off |
Blue-green gives you the cleanest gate of the four because green is fully deployed and fully isolated when you test it. You get a complete production replica to verify against, with zero user exposure, and a single atomic switch. Canary trades that clean gate for gradual exposure and leans harder on live monitoring. For most API-backed services, blue-green plus a pre-cutover suite is the simplest way to get high confidence without a maintenance window.
Real-world shape of this
A fintech team running a payments API uses blue-green for every release because a bad deploy isn’t a cosmetic bug, it’s a failed transaction. Their gate is a forty-scenario suite against green covering auth, idempotency keys, currency rounding, and webhook signatures. The full run takes about six minutes. Nothing reaches production until it’s green across the board, and the HTML report is attached to every deploy for the audit trail.
A SaaS team with a public API runs a leaner version: a twelve-scenario smoke gate against green, then the switch, then a post-cutover smoke test against the live URL. Their priority is catching schema drift, since third-party integrations break loudly when a field changes shape. Schema assertions on every response are the heart of their gate.
Both teams build the scenarios once in Apidog and run them unattended from the CLI on every push. The desktop app stays the place where engineers debug and extend scenarios; the pipeline is where those same scenarios become the release gate.
Conclusion
Blue-green deployment gives you a free, fully-deployed copy of production sitting idle before every release. Wasting that by checking only a shallow health probe is the most common way teams ship breakage with a zero-downtime strategy. The fix is to test green like a user before you flip the switch.
The pieces:
- Build real test scenarios (auth, read, write, negative cases, schema assertions) once, in Apidog.
- Use an environment variable for the base URL so the same suite runs against green and blue unchanged.
- Run a fast smoke test first, then the full suite, both pointed at the green environment.
- Gate the cutover on the suite’s exit code in your pipeline so a failure blocks the switch.
- Keep blue warm for instant rollback through your monitoring window.
Set this up once and every deploy gets the same gate automatically. Download Apidog to build your readiness suite, generate a CI config, and drop the apidog run step into your pipeline before the switch stage. Your first real user should never be your first real test.
FAQ
What is blue-green deployment in simple terms? It’s running two identical production environments and switching all traffic between them. One (blue) serves live users while the other (green) gets the new version. You test green, then flip a single switch so green becomes live. Blue stays as an instant rollback target.
How do I test the green environment before switching traffic? Point your API test suite at the green environment’s base URL and run it in your pipeline before the cutover step. With the Apidog CLI, run your scenarios with apidog run against the green environment, fail the deploy on any broken assertion, and only switch traffic if the suite passes.
Why isn’t a load balancer health check enough for blue-green? A health check usually pings one endpoint and confirms a 200, which only proves the process is running. It won’t catch a renamed JSON field, a failed migration, a broken auth flow, or a schema change. A real API test suite asserts on response bodies, schemas, and error cases, so it catches the failures a health probe waves through.
Can I run the same API tests in CI that I built in the desktop app? Yes. Scenarios you build visually in Apidog run unchanged from the Apidog CLI. You generate a CI config for a scenario, then call apidog run with that config in GitHub Actions, GitLab CI, Jenkins, or any pipeline. The CLI exits non-zero on failure, which lets you gate the deploy.
What’s the difference between blue-green and canary deployment for testing? Blue-green switches all traffic at once after you test the fully-deployed green environment, so the gate is pre-cutover. Canary shifts traffic gradually to a small slice and relies on live monitoring of that slice. Blue-green gives a cleaner pre-release test gate; canary gives gradual real-world exposure.
Should I run write-path tests against the green production environment? Be careful with data. Either use a dedicated test account whose records you clean up, or run write tests against a green instance backed by a staging database before promoting the data layer. The goal is verifying behavior without polluting production data, which is the line between a sandbox and a true production test.
How fast should the pre-switch test gate be? Split it. Run a smoke test of three to five critical-path requests in under thirty seconds to fail fast, then run the full suite (every endpoint, error cases, schema checks) only if the smoke test passes. A complete gate of a few dozen scenarios usually finishes in a handful of minutes, which is acceptable for a release gate.